How-to
How to make a BPMN diagram from a description
How to make a BPMN 2.0 diagram fast: describe the process, roles, and decisions, and ChartCraft draws events, tasks, and gateways for you.
Step by step
01Name the trigger and outcomes
What starts the process (an application arrives) and every way it can end (approved, rejected, withdrawn)? Each outcome gets its own end event.
02Identify the roles
Who participates — employee, manager, finance, a payment system? Each becomes a lane, and every task will live in exactly one.
03List the tasks per role
Walk the process chronologically, writing each unit of work as verb + object (“Submit expense report”, “Approve claim”) inside its owner's lane.
04Route with gateways
Either/or decisions get exclusive gateways with a condition on every outgoing path; work that genuinely happens simultaneously gets a parallel split and a matching join.
05Generate and validate
Describe the process, roles included, in plain English — ChartCraft draws events, tasks, gateways, and lanes. Check every path reaches an end event, then export.
From sentence to BPMN, in three passes
BPMN rewards starting narrow: one lane and the happy path, then the decision, then the extra roles. An expense approval process, one pass at a time.
Pass 1 · You type
An employee submits an expense report with receipts attached.
One lane, three elements: a start event (thin circle), a user task, an end event. Every BPMN diagram, however grand, is this shape with more of everything.
Pass 2 · You add
Expenses over $500 need manager approval; smaller ones are reimbursed automatically.
The manager joins as a lane, and the threshold becomes an exclusive gateway with both paths labelled. The handoff between lanes is now visible — which is usually the whole point of the diagram.
Pass 3 · You finish
Finance processes approved payments; a rejected expense ends separately with the employee notified.
Finance gets a lane and a service task (a system acts, not a person), and rejection gets its own end event. Distinct end events per outcome make the process auditable at a glance — count the circles, know the ways it can end.
Best practices — and the classic mistakes
Do
- Label every path out of an exclusive gateway with its condition — an unlabelled gateway is a coin flip.
- One lane per role that actually does something; systems that merely store data don't earn a lane.
- Name tasks verb-first and keep them atomic — “Review application”, not “Handle stuff”.
- Separate the happy path from exception handling; boundary events or a second diagram beat a spaghetti main flow.
- Every parallel split needs a matching join — unbalanced gateways are the classic BPMN bug.
Avoid
- Gateways used as decisions AND merges inconsistently, leaving token flow ambiguous.
- A lane for every system in the architecture, most of which never act.
- Processes with one giant “Process request” task — no visibility into the actual work.
- Missing end events for rejection/withdrawal paths, implying every case succeeds.
The notation, in 30 seconds
BPMN 2.0 has a large vocabulary, but five element families carry everyday process modelling.
| Element | What it means |
|---|---|
| Start / end events (circles) | Thin circle starts the process, thick circle ends it. One trigger in, one circle per distinct outcome. |
| Task (rounded rectangle) | A unit of work. User tasks (a person acts), service tasks (a system acts), script tasks (code runs). |
| Exclusive gateway (X diamond) | Either/or routing — exactly one outgoing path fires, each labelled with its condition. |
| Parallel gateway (+ diamond) | Both/and — all outgoing paths run; a matching gateway joins them back. |
| Lane | A horizontal band per role or department — the task's lane says who does it. |
| Message flow (dashed) | Communication crossing organizational boundaries, between separate pools. |
Worked BPMN diagram examples
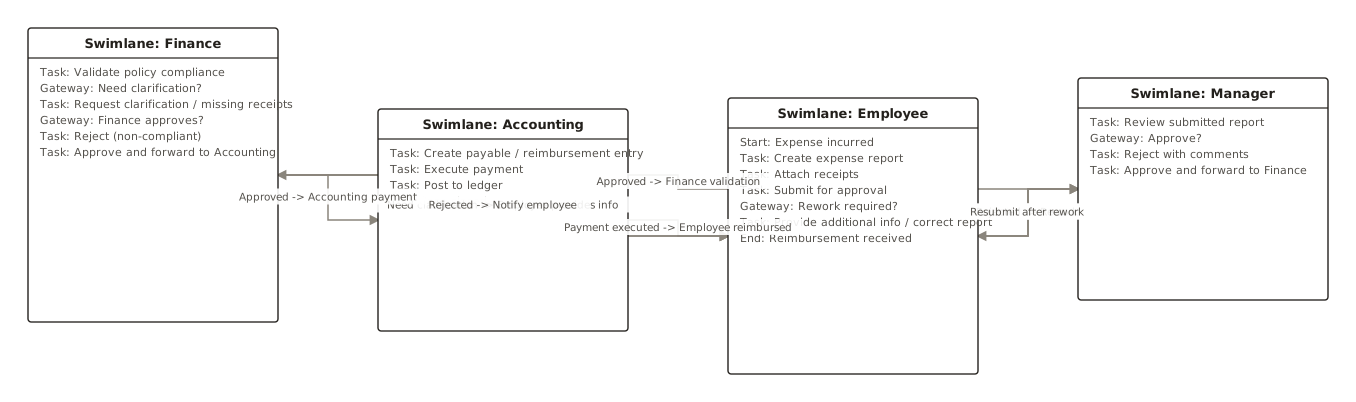
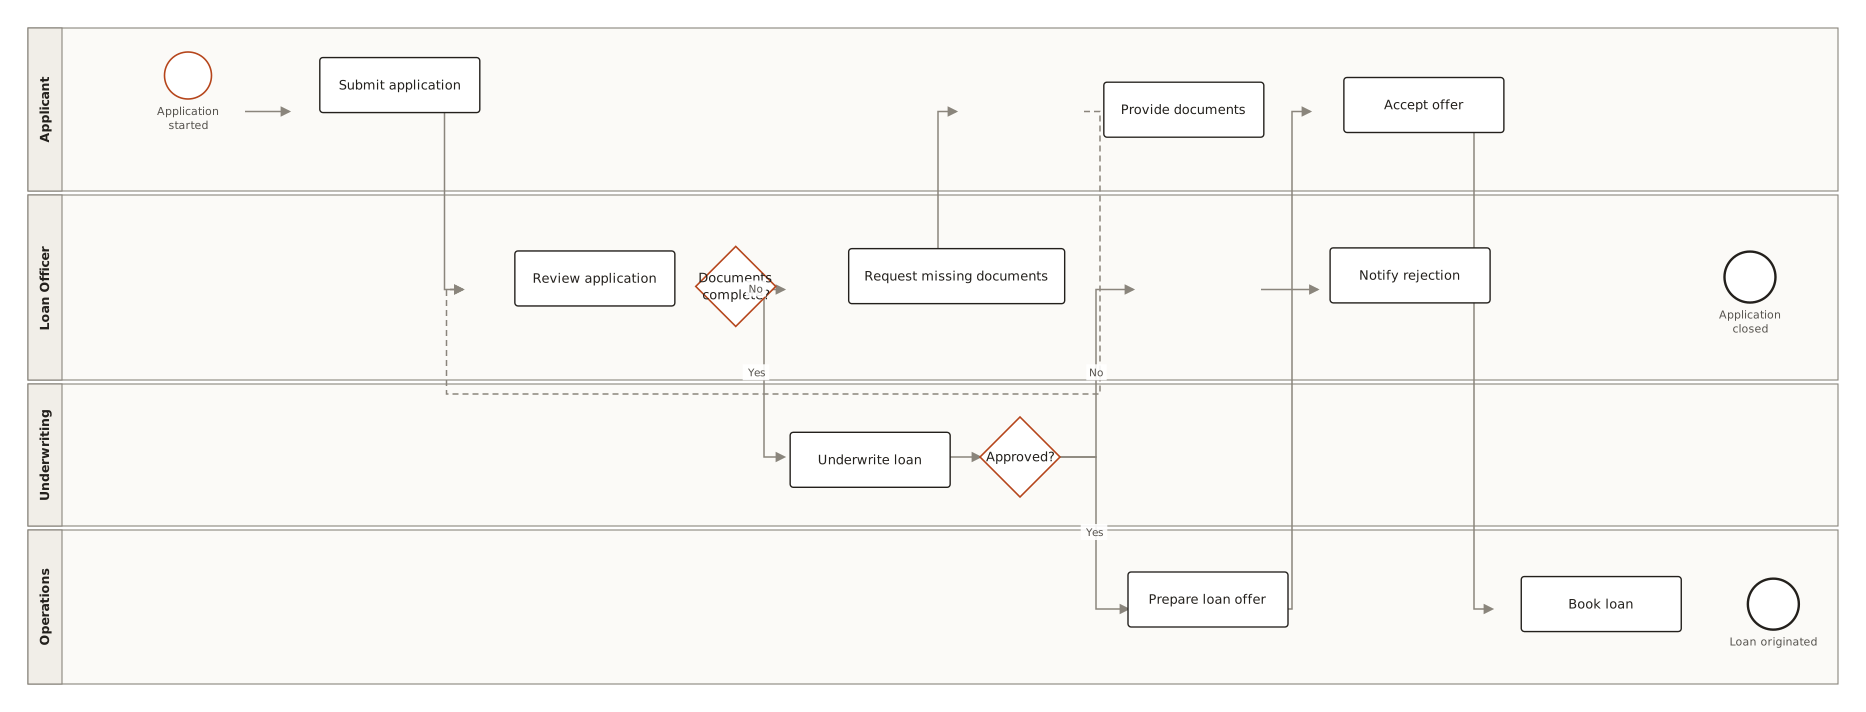
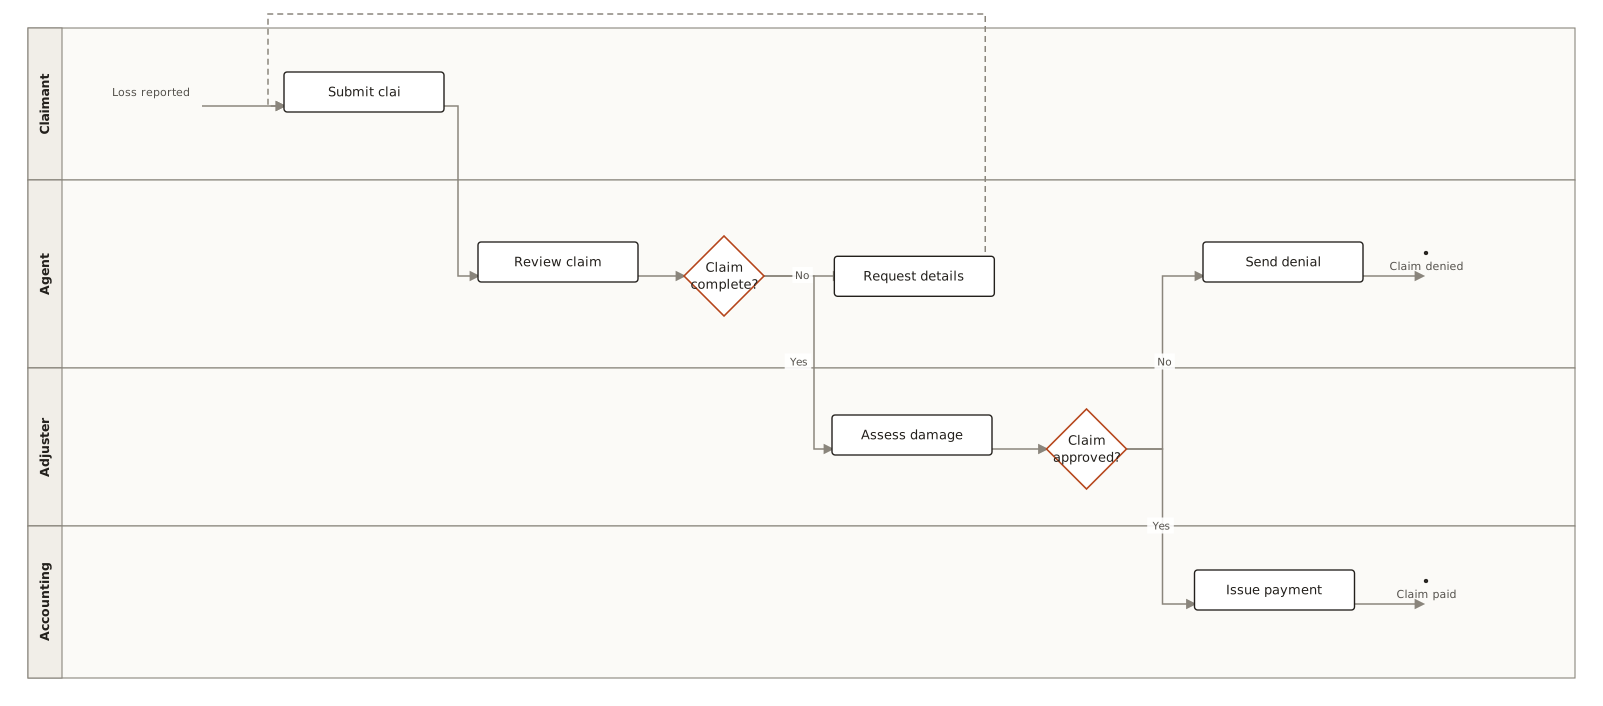
Generated with ChartCraft and published in the examples gallery — open one to see its prompt, or use it as a starting point.
Questions
What's the fastest way to make a BPMN diagram?
Describe it in plain English. ChartCraft parses your description, builds the BPMN diagram, and runs an automatic layout so you don't place or connect anything by hand.
Do I need to know any diagram syntax?
No. You write a normal sentence or two; ChartCraft handles the notation and layout.
What's the difference between BPMN and a flowchart?
BPMN is a standardized process language: lanes assign work to roles, event types distinguish triggers, and gateway semantics are precise enough to execute in a workflow engine. A flowchart is freer-form and better for quick explanations.
When do I need lanes?
As soon as more than one role touches the process. Lanes make handoffs visible — and handoffs are where processes stall, so they're usually the point of drawing the diagram.
Can I export the result?
Yes, export to SVG or PNG on any plan, including the free tier.