Data Flow Diagram
Data flow diagram generator — DFDs from text
Describe where data comes from, which processes transform it, and where it's stored, and ChartCraft draws the data flow diagram — external entities, numbered processes, data stores, and every flow labelled.
Prose in. Diagram out.
You type
Level 0 DFD for an online store: customers send orders and payment info to the system; the system sends charge requests to the payment gateway and pick lists to the warehouse.
ChartCraft draws
How it works
Describe it
Write what you want in plain English — no syntax to learn.
ChartCraft compiles
It parses your description, builds the structure, and runs an automatic layout.
Refine & export
Tweak with follow-up messages, then export clean SVG or PNG.
The four DFD symbols
Data flow diagrams use exactly four symbols — that discipline is what makes them readable.
| Symbol | What it means |
|---|---|
| External entity (rectangle) | A source or sink of data outside the system: Customer, Bank, Tax Authority. Also called a terminator. |
| Process (rounded box / circle, numbered) | Something that transforms data: “1.0 Collect timesheets”. Name with verb + object, number for decomposition. |
| Data store (open-ended rectangle, D1, D2…) | Data at rest: a database table, a file, an archive. Stores don't talk to each other directly — a process sits between. |
| Data flow (labelled arrow) | Data in motion. Every arrow gets a noun label — “hours worked”, “payment file”. An unlabelled flow is a bug. |
DFD levels: 0, 1, 2
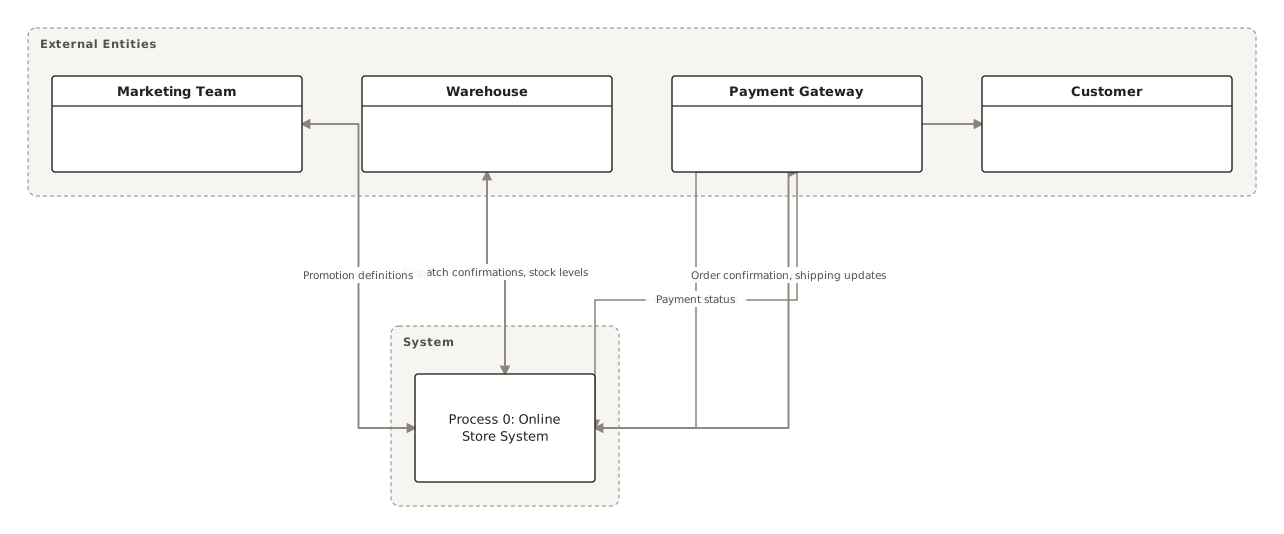
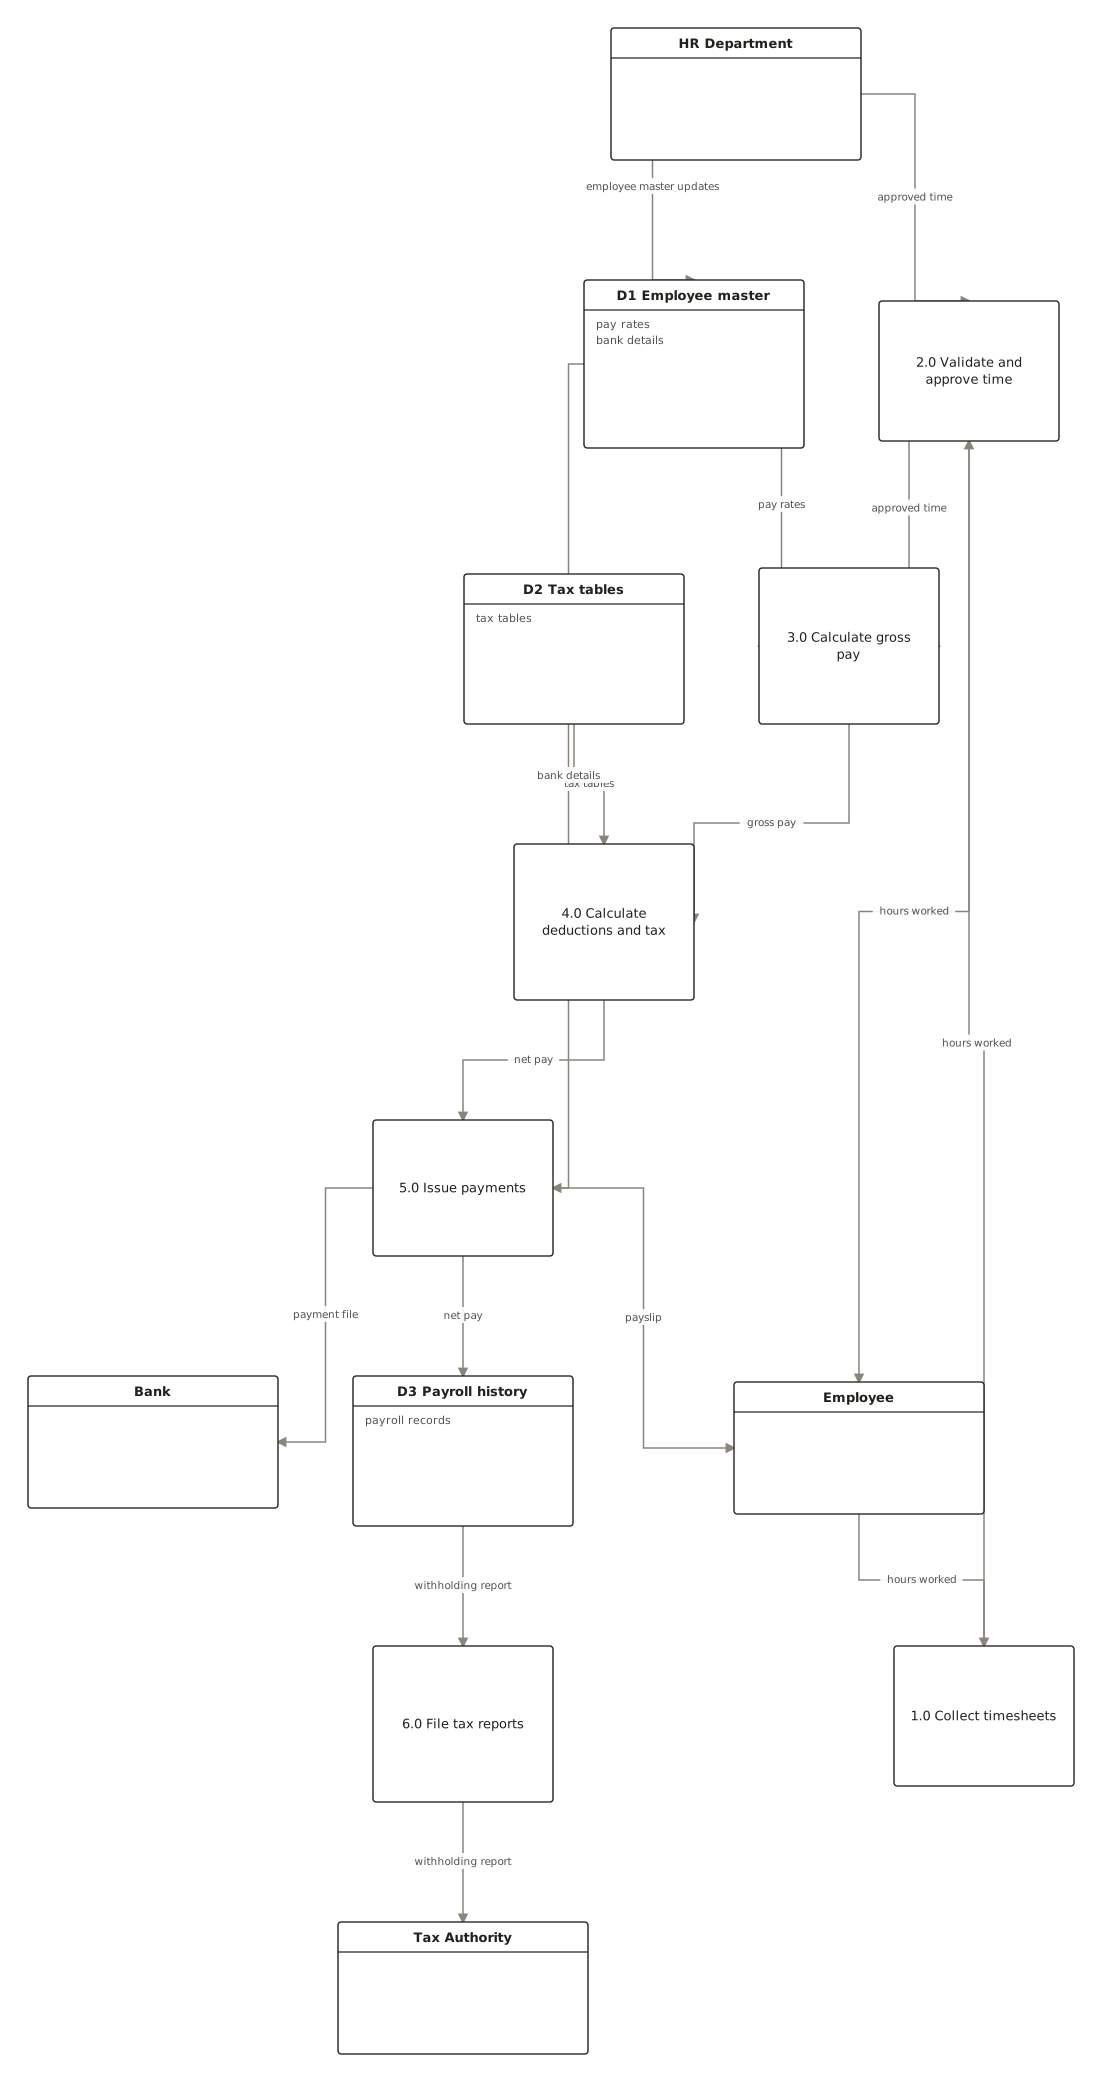
DFDs zoom by decomposition. Level 0 (the context diagram) is one process bubble — the whole system — plus the external entities around it. Level 1 explodes that bubble into the 5–9 major processes and introduces data stores. Level 2 explodes one level-1 process when it's genuinely complex. Number processes so the hierarchy is traceable: process 3.0 at level 1 becomes 3.1, 3.2… at level 2.
Data flow diagram examples
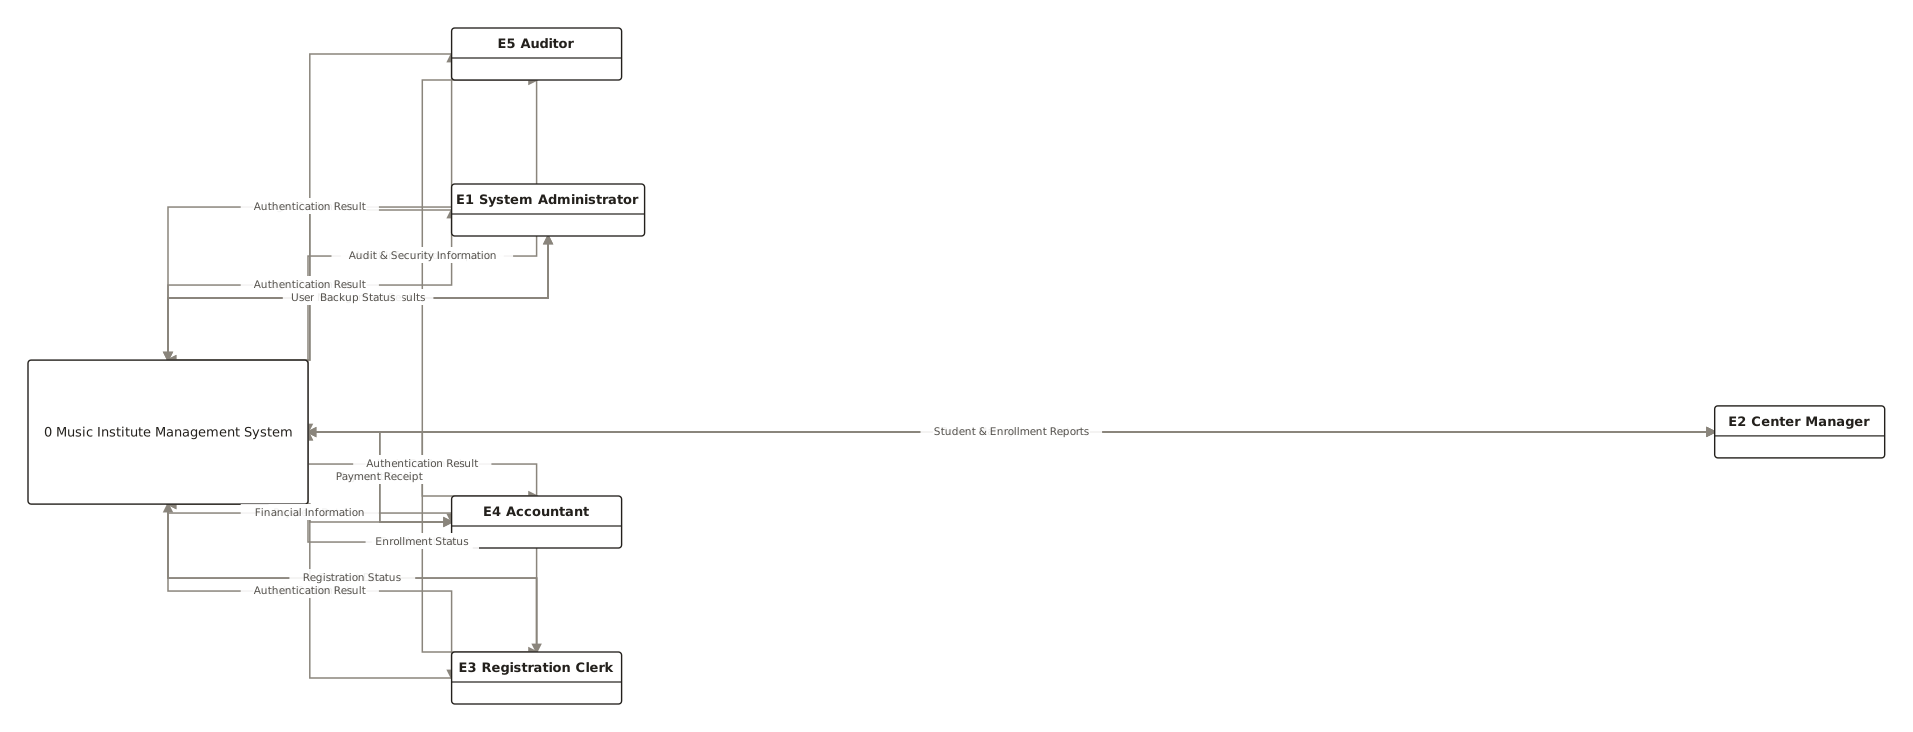
From the public examples gallery — every one produced from a plain-English description. Open one to see its prompt.
Questions
What is a data flow diagram?
A diagram that shows how data moves through a system: where it enters (external entities), what transforms it (processes), where it rests (data stores), and every flow between them, labelled. It deliberately ignores timing and control — only data movement.
What's the difference between a data flow diagram and a flowchart?
A flowchart shows control flow — the order steps happen in, with decisions and loops. A DFD shows data flow — what information moves where, with no ordering at all. “First do A, then B” is a flowchart; “invoice data goes from billing to the ledger” is a DFD.
What is a level 0 data flow diagram?
The context diagram: the entire system as a single process, surrounded by its external entities and the data flowing in and out. No data stores, no internals. It fixes the system boundary before you decompose.
How many processes should a level 1 DFD have?
Five to nine. Fewer and you haven't decomposed; more and the diagram stops being readable — push detail down to level 2 instead.
Can I export the diagram?
Yes, export to SVG or PNG with no watermark on any plan.