How-to
How to draw a state machine diagram from a description
How to draw a state diagram fast: describe the states and transitions of a lifecycle, and ChartCraft lays out the state machine automatically.
Step by step
01List the resting states
Ask: “what can this thing be, while nothing is happening?” Pending, Active, Suspended. If it's a verb, it's an action — not a state.
02List the events
What happens in the world that this object reacts to? Payments, timeouts, button presses, sensor faults. Events cause transitions; states don't change on their own.
03Draw the transitions
For each state, walk the event list: which events matter here, and where do they lead? Events that can't happen in a state simply have no arrow.
04Check reachability and exits
Every state must be reachable from Start, and anything non-terminal needs a way out — including failure paths like timeout or cancel.
05Generate and stress-test
Describe the lifecycle in plain English; ChartCraft draws the machine. Then ask “what if X happens while in Y?” for the awkward combinations — that's where real bugs live.
From sentence to state machine, in three passes
State machines are best grown pessimistically: happy path first, then the rejections, then the endings. A document approval workflow, one pass at a time.
Pass 1 · You type
A document starts in Draft. Submitting moves it to In Review; approval publishes it.
Three states, two events. Notice the names: states are conditions (Draft, Published), transitions are verbs (submit, approve). Getting that grammar right keeps the machine honest.
Pass 2 · You add
A reviewer can reject the document, sending it back to Draft with feedback.
The reject event creates a cycle — Draft and In Review can alternate forever. Cycles are what separate state machines from flowcharts, and they're one sentence to add.
Pass 3 · You finish
Published documents can be archived. Archiving is final.
A terminal state closes the lifecycle. Before exporting, stress-test the machine: what happens to a document in Review when the author leaves? If the answer isn't on the diagram, the machine isn't finished — it's just not failing yet.
Best practices — and the classic mistakes
Do
- Name states with adjectives or past participles (Paid, Locked), events with verbs (pay, lock).
- Model one object per machine — the order, not the order plus the warehouse plus the emails.
- Give every non-terminal state an exit for failure events, not just the happy path.
- Prefer guards over duplicate states: one “pay” transition with [balance ≥ price] beats two near-identical states.
- Keep it to 5–9 states; past that, look for nested (composite) states or a second machine.
Avoid
- States named as actions (“Sending email”) — that's a transition or activity, not a resting state.
- Missing failure transitions — the machine describes the demo, not the system.
- Two states that differ only by a flag — usually one state with a guard.
- No terminal state, leaving readers unsure whether the lifecycle ever ends.
The notation, in 30 seconds
A state machine is four ideas: states, events, transitions, and the start/end markers. Everything else is refinement.
| Element | What it means |
|---|---|
| Initial state (filled dot) | Where the machine begins — exactly one per diagram. |
| State (rounded box) | A condition the object can rest in: Pending, Shipped, Locked. Name with adjectives or nouns, never verbs. |
| Transition (arrow + event) | The move between states, labelled with the event that causes it: pay, timeout, cancel. |
| Guard ([condition]) | A bracketed condition that must hold for the transition to fire: pay [balance ≥ price]. |
| Final state (bullseye) | A terminal state the object never leaves — Delivered, Closed. |
| Self-transition | An event that re-enters the same state — a retry that doesn't change status. |
Worked state diagram examples
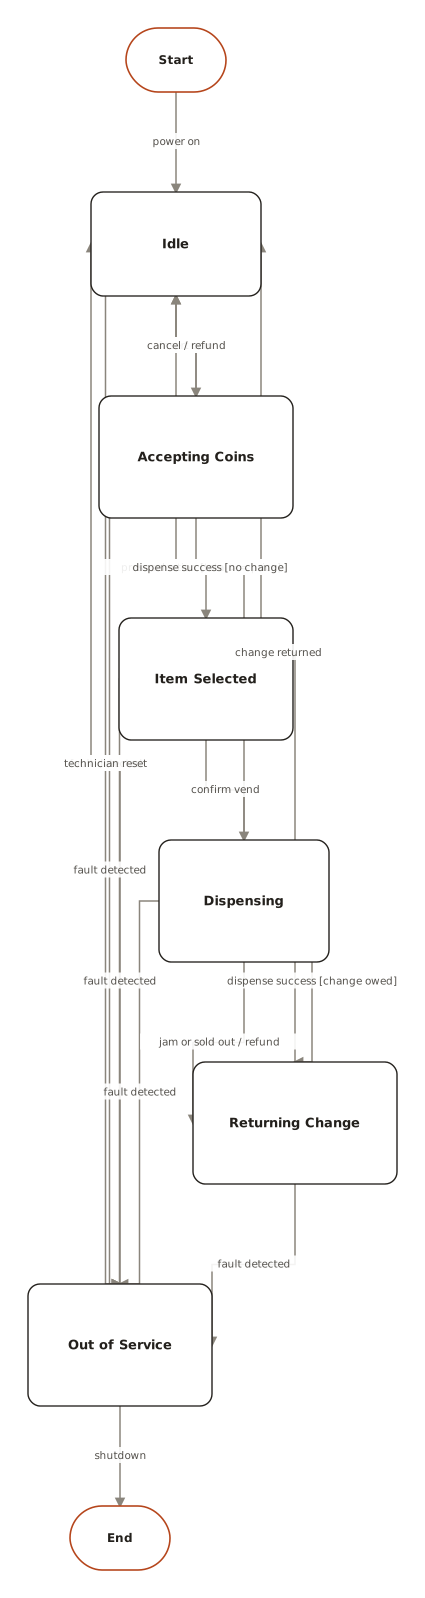
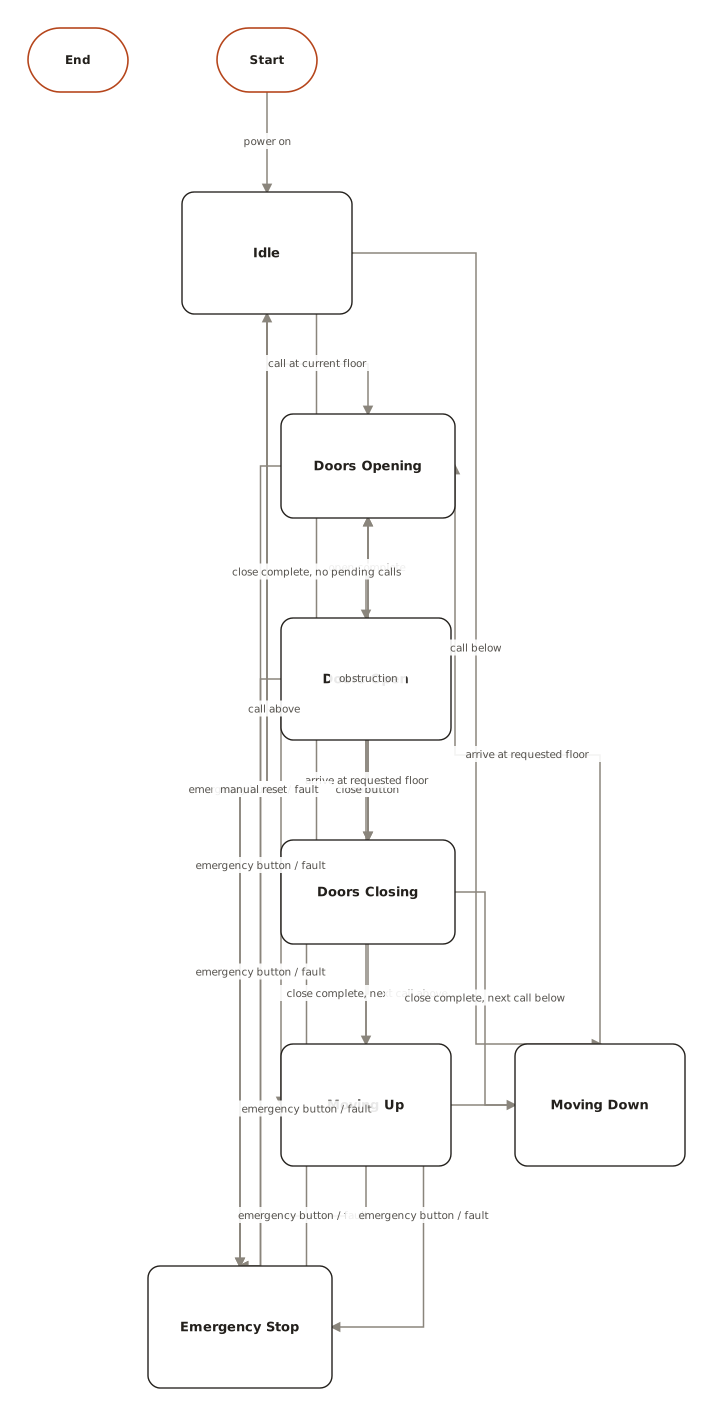
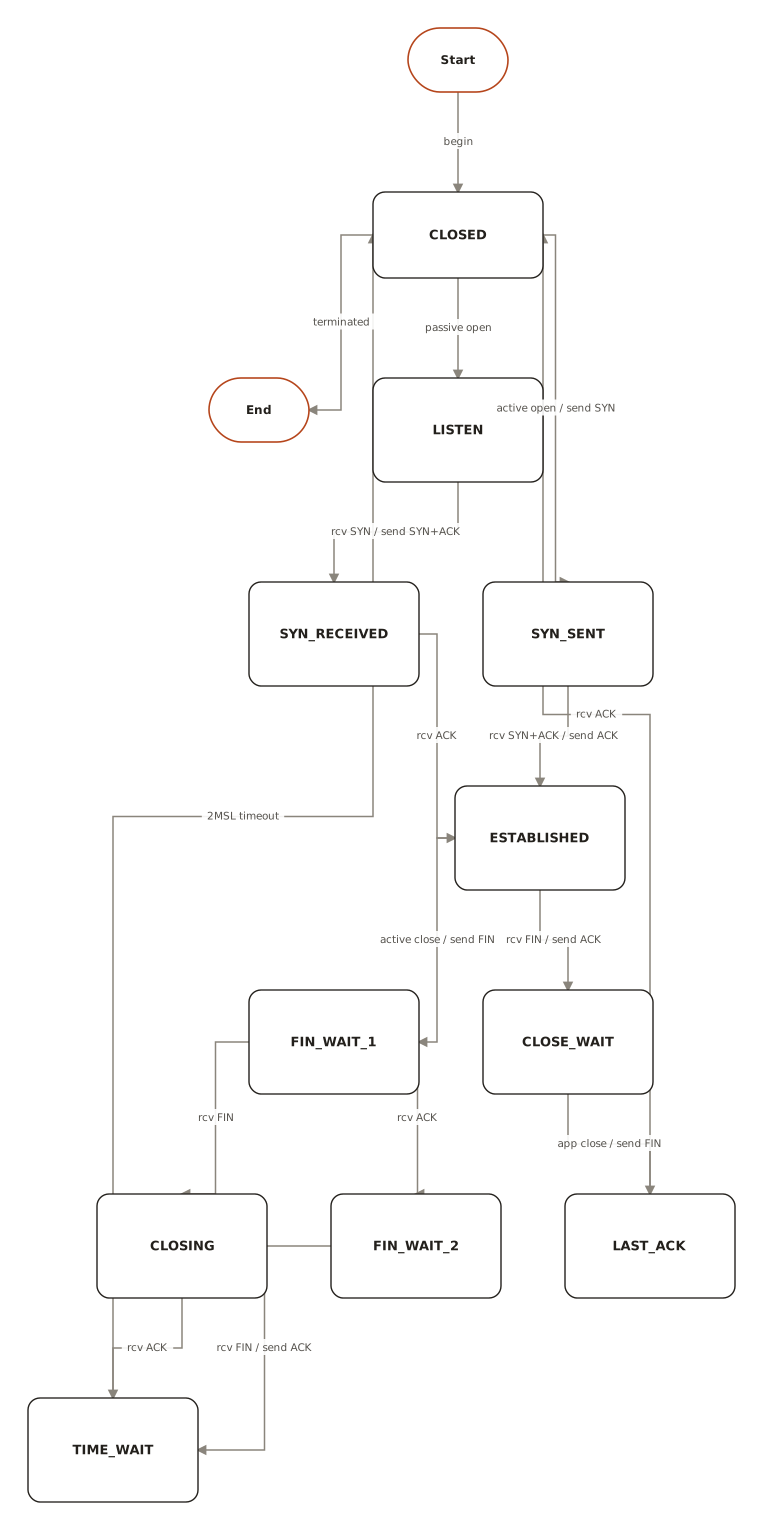
Generated with ChartCraft and published in the examples gallery — open one to see its prompt, or use it as a starting point.
Questions
What's the fastest way to make a state diagram?
Describe it in plain English. ChartCraft parses your description, builds the state diagram, and runs an automatic layout so you don't place or connect anything by hand.
Do I need to know any diagram syntax?
No. You write a normal sentence or two; ChartCraft handles the notation and layout.
What's the difference between a state diagram and a flowchart?
A flowchart follows a process from start to finish — steps happen once, in order. A state machine describes one object over its whole life: it rests in states and moves only when events fire, possibly cycling forever.
How do I know if something is a state or a step?
Ask whether the object can sit there indefinitely. “Pending approval” can last a week — state. “Send the approval email” takes milliseconds and completes — that's a transition's side effect.
Can I export the result?
Yes, export to SVG or PNG on any plan, including the free tier.