System diagram examples: 10 real architecture and system diagrams
In short
A system diagram shows the parts of a system and the connections between them. The ten examples below are real diagrams from the ChartCraft gallery, each generated from a text description: layered and microservice architectures, event-driven and IoT platforms, a Kubernetes deployment, C4 context and container views, a network topology, a level 0 data-flow diagram and a von Neumann block diagram. Each card says what type of system diagram it is and why it is laid out the way it is; the comparison table tells you which type to draw for your own system.
Like these. Each example is a live diagram: open it to see the full-size SVG and the plain-English prompt it was generated from, then edit the prompt to turn it into your own system.
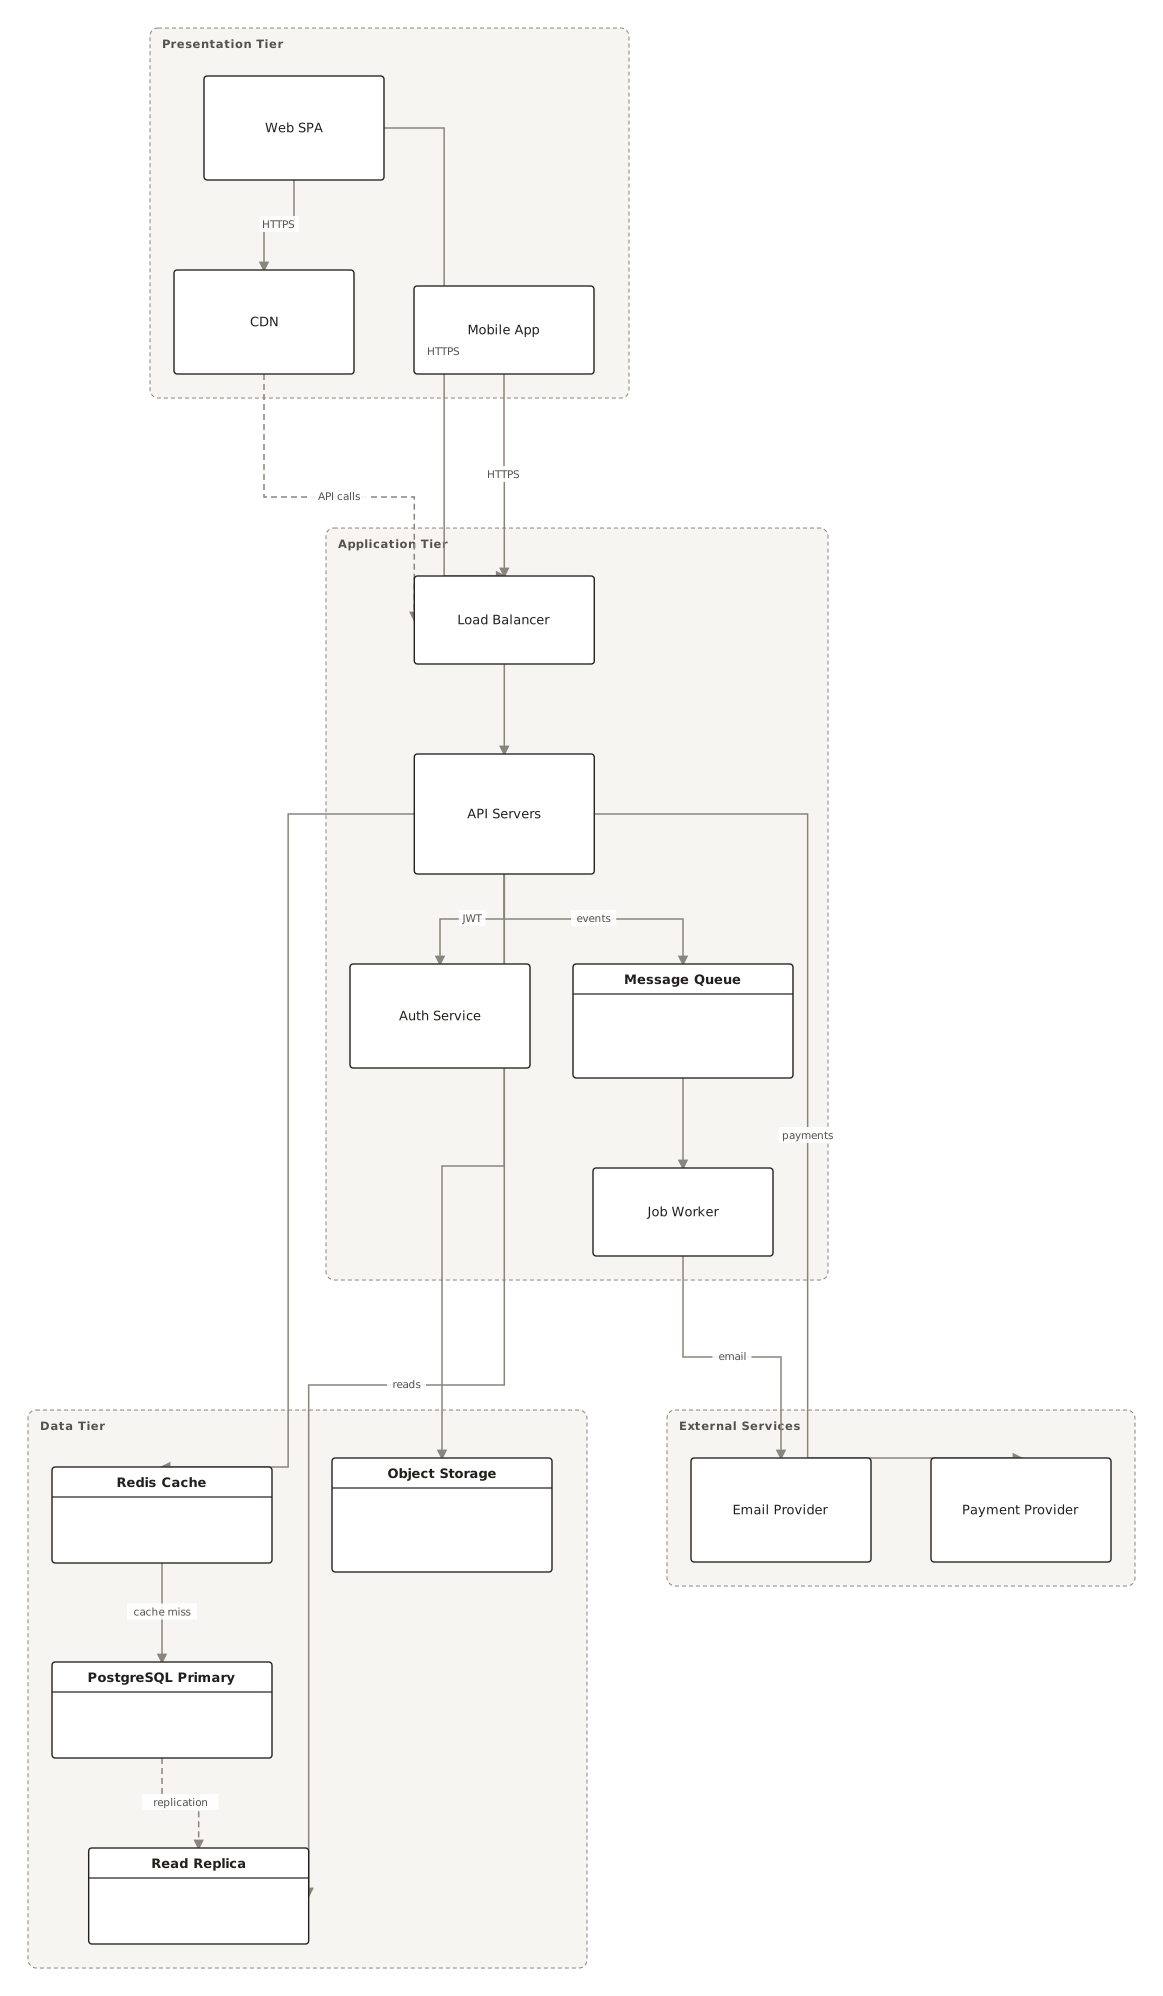
Four lanes, left to right: a presentation tier (web SPA, mobile app, CDN), an application tier (load balancer, API servers, auth service, message queue, job worker), a data tier (Redis cache, PostgreSQL primary with a read replica, object storage) and external services (email and payment providers). Requests enter over HTTPS, the load balancer fans them out to stateless API servers, and the servers talk to the cache before the primary database on a cache miss. Replication to the read replica and the queue-to-worker path for events are drawn as their own labelled edges so the asynchronous work is visibly separate from the request path. The tiers are columns because each tier can be scaled or replaced on its own; that independence is the whole point of the pattern.
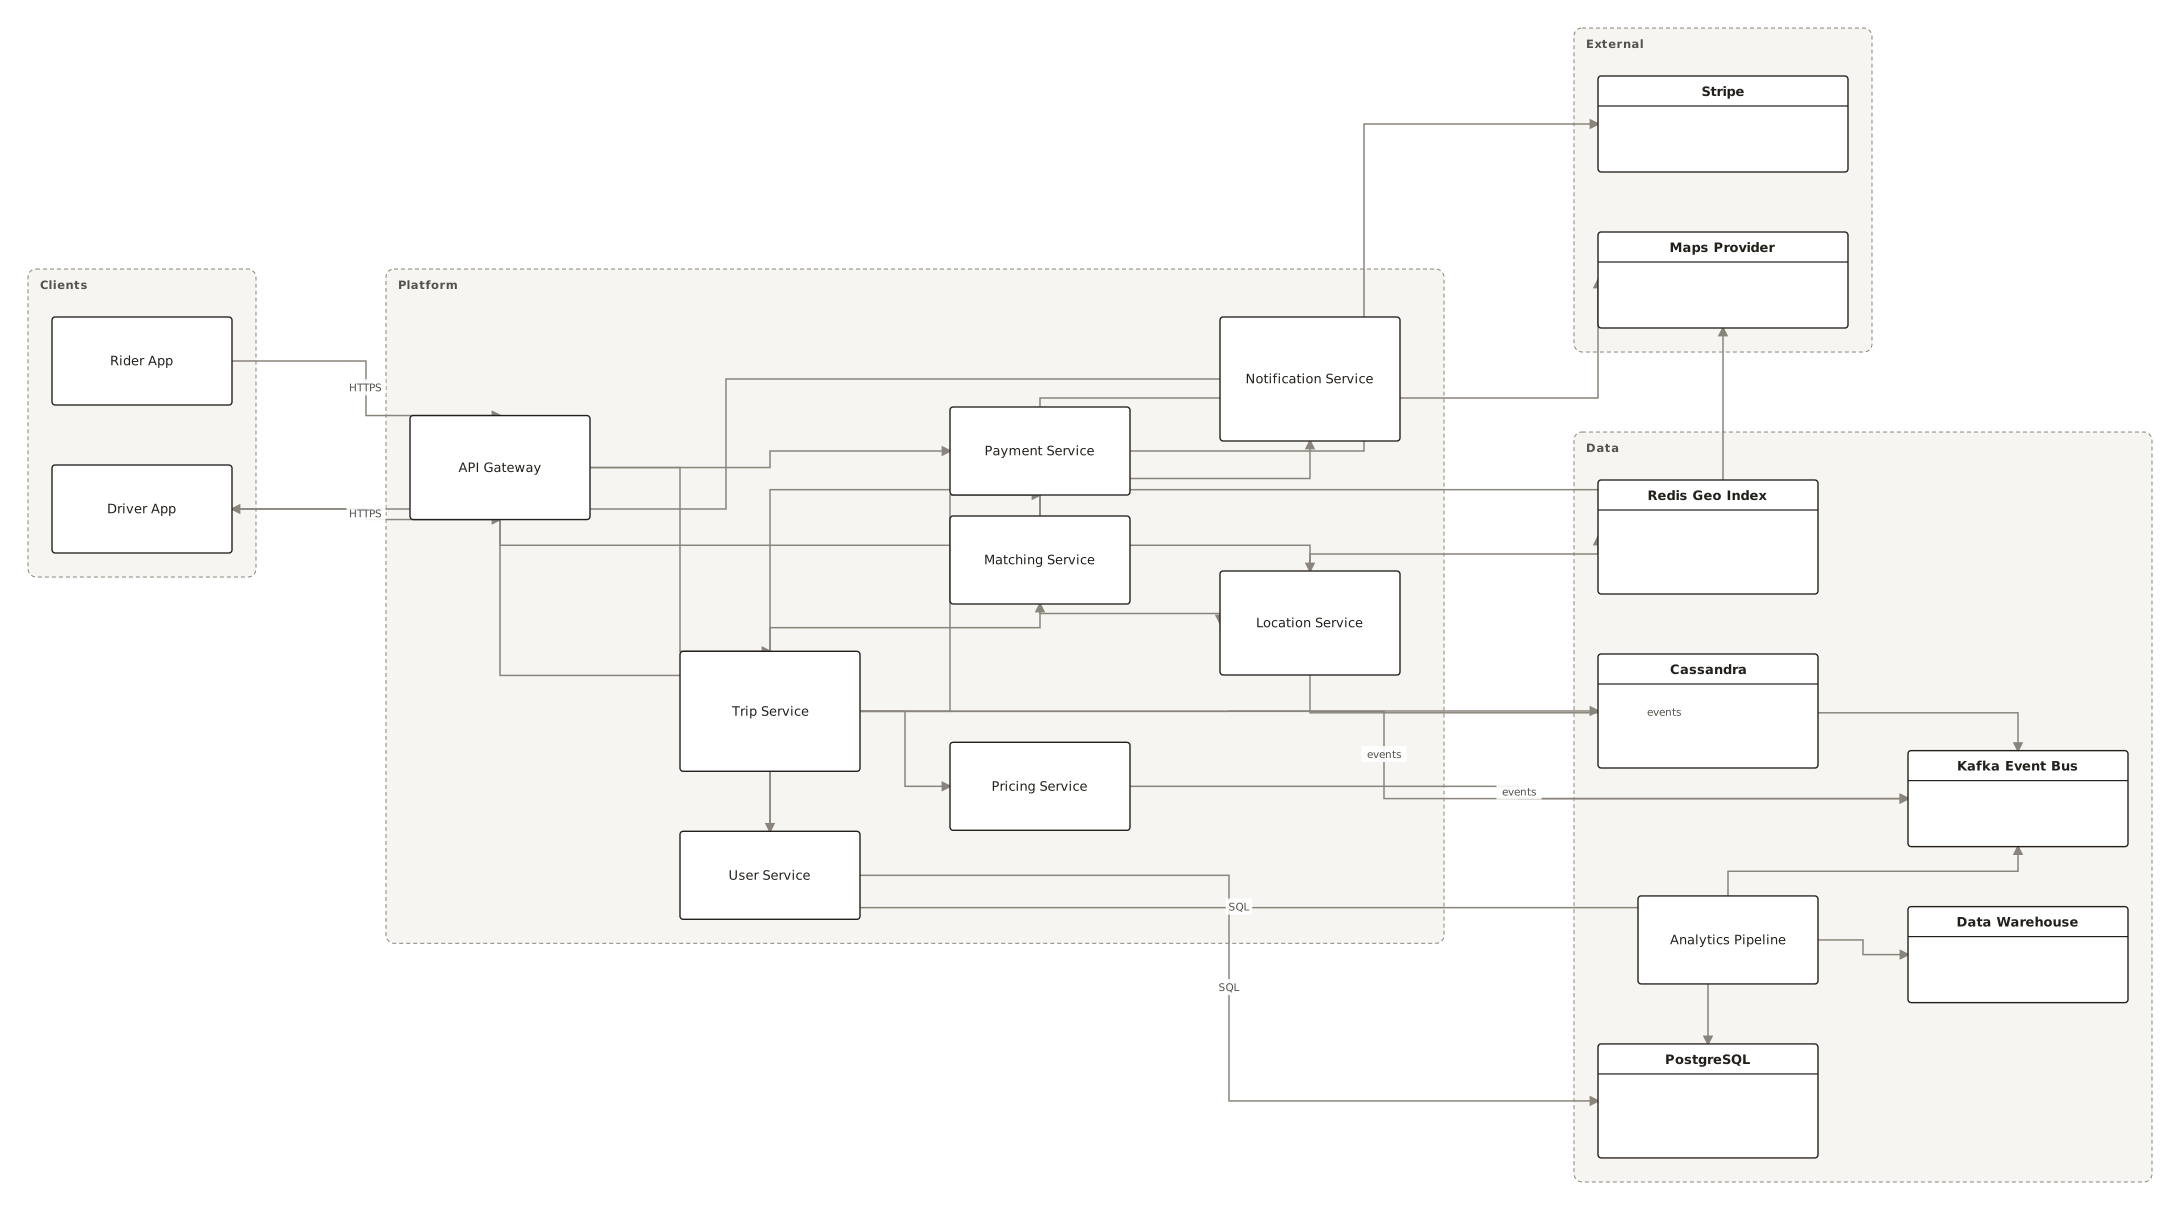
The rider and driver apps hit one API gateway, which routes to eight services (user, trip, matching, location, pricing, payment, notification) in the platform lane. Below them sits the data lane: PostgreSQL for transactional records, a Redis geo index for live driver positions, Cassandra for high-write trip telemetry, a Kafka event bus, and an analytics pipeline feeding a data warehouse. External dependencies (maps provider, Stripe) are isolated in the rightmost lane. The layout is a grouped left-to-right flow because the question an architecture diagram answers is "what calls what"; grouping by lane keeps the fan-out from the gateway legible.
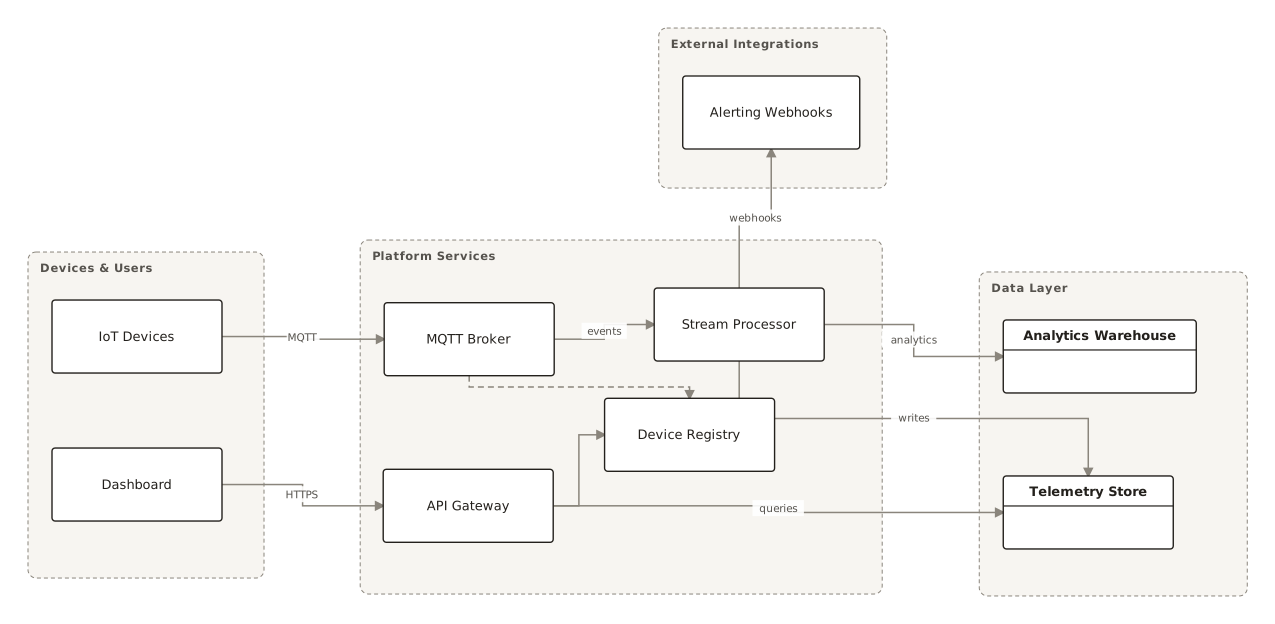
Devices publish telemetry over MQTT to a broker; a device registry authenticates them; a stream processor consumes broker events and writes to a telemetry store and an analytics warehouse; an API gateway serves the dashboard with HTTPS queries. Alerting webhooks are the external integration. The four lanes (devices and users, platform services, data layer, external integrations) separate the high-volume ingest path from the low-volume query path, which is the key design decision in any IoT system.
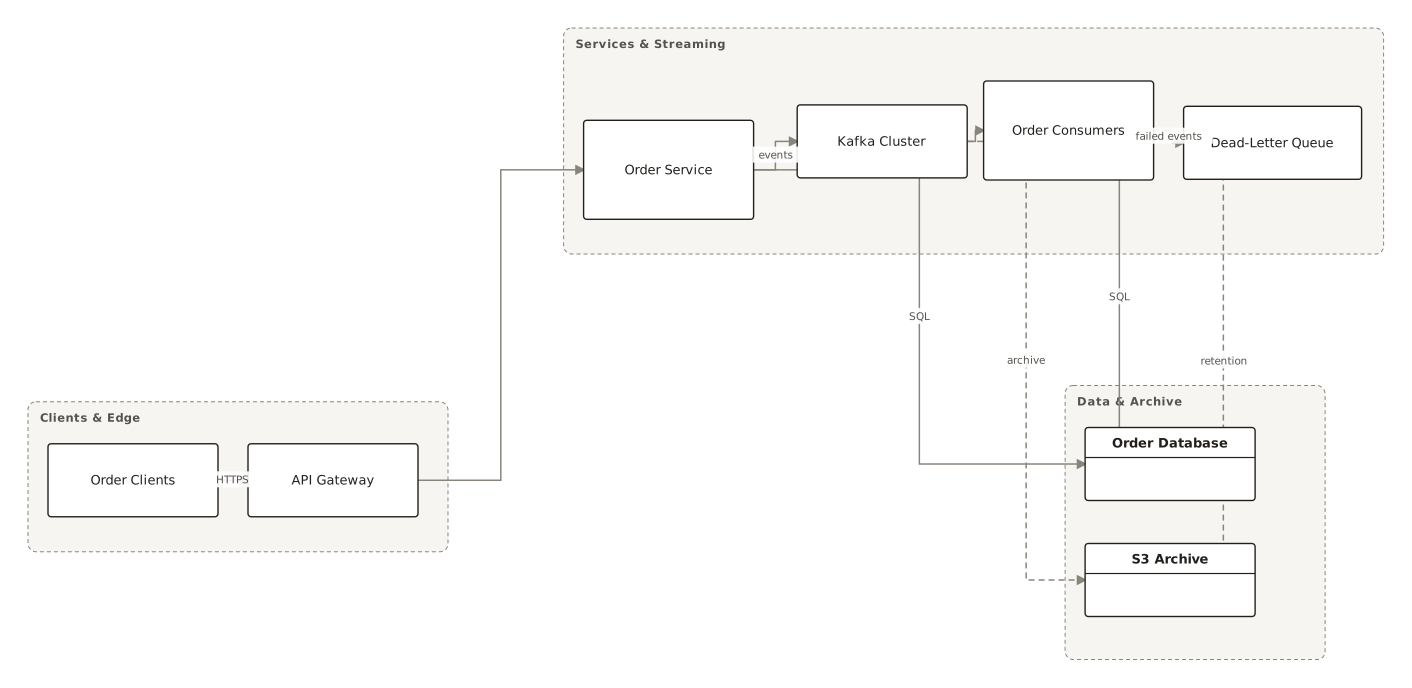
Order clients call an API gateway, the order service writes to its database and publishes events to a Kafka cluster, and a pool of order consumers processes them. Failed events are routed to a dead-letter queue; processed events are archived to S3 under a retention policy. The diagram exists to make the failure path explicit: the dead-letter queue and archive are first-class nodes, not footnotes, because that is where event-driven systems go wrong in production.
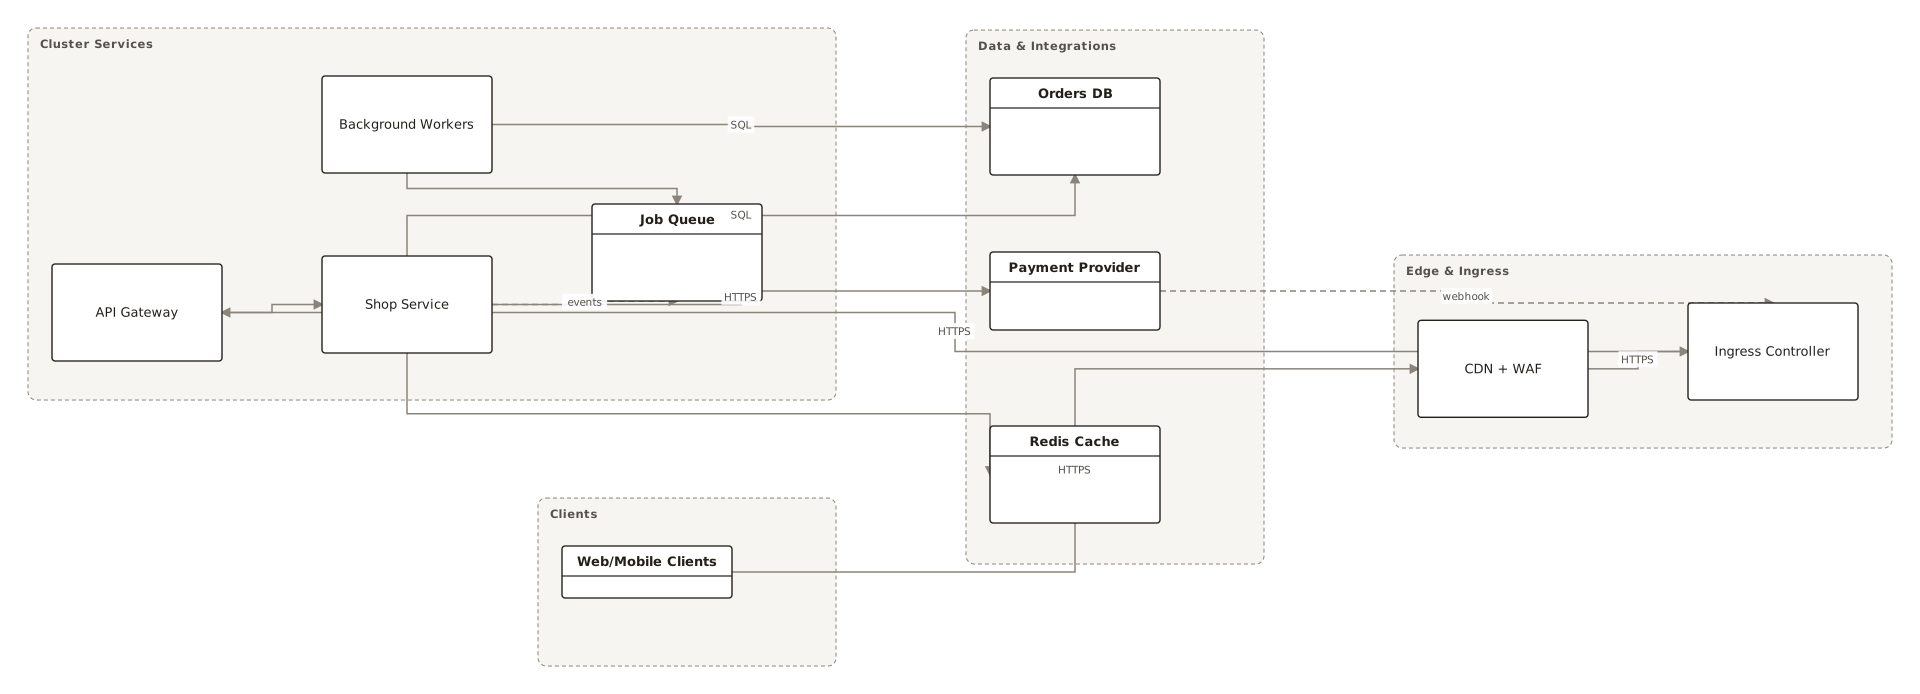
Traffic from web and mobile clients passes a CDN with a WAF, then an ingress controller and an API gateway at the edge of the cluster. Inside the cluster a shop service and background workers share a job queue; outside it sit the orders database, a Redis cache and a third-party payment provider that calls back over a webhook. This is a deployment view: the groupings are where things run (edge, cluster, data and integrations), not what they do, so it answers questions about network boundaries and blast radius rather than business logic.
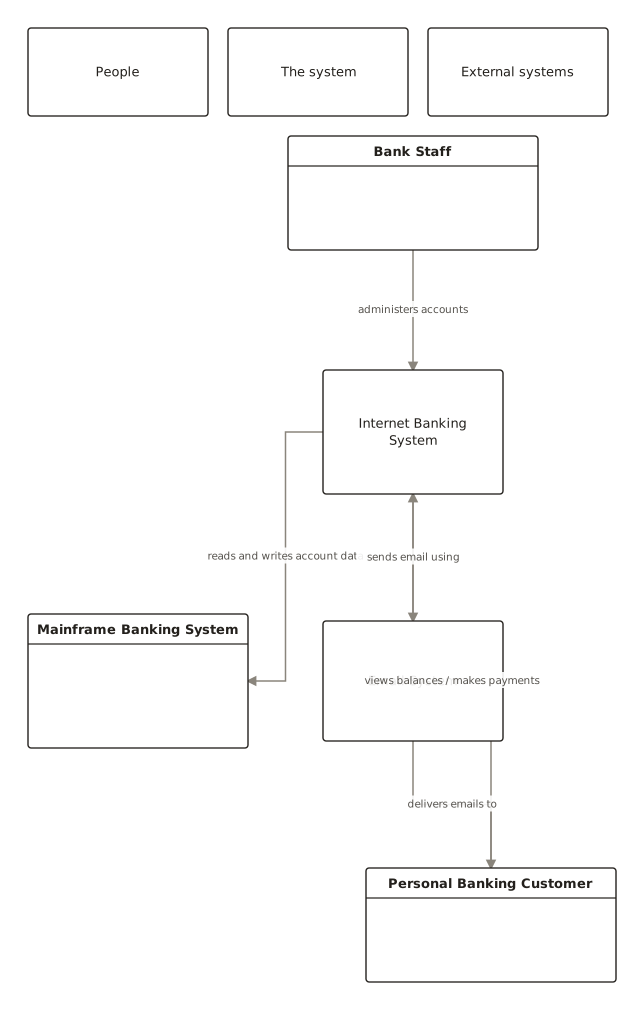
The classic C4 example: two people (personal banking customer, bank staff), the internet banking system in the centre, and two external systems (mainframe banking, email). Every edge is a sentence ("views balances / makes payments", "reads and writes account data", "sends email using"). A context diagram deliberately shows nothing inside the system; its job is to fix the boundary and name every neighbour, so it is small on purpose.
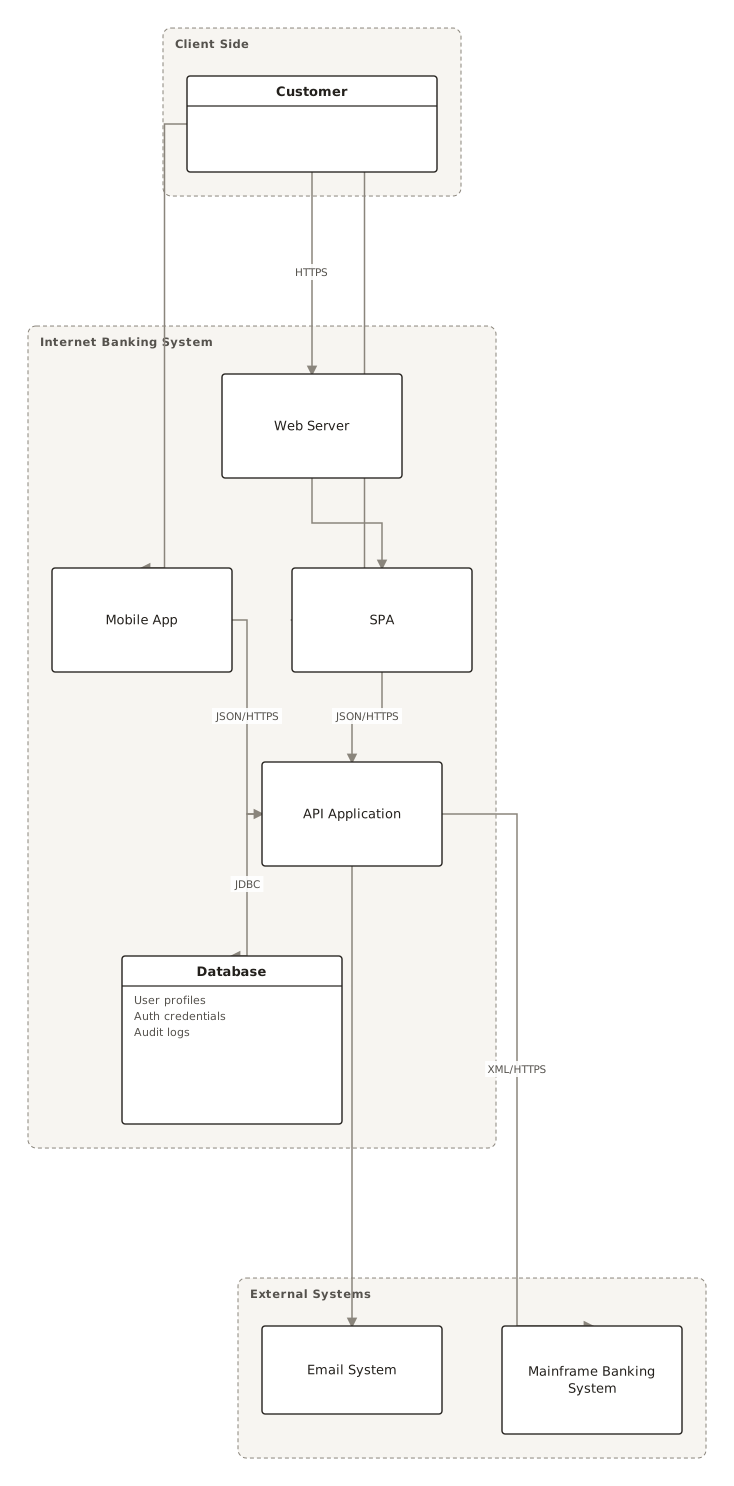
Zoom one level into the same system: a single-page app and a mobile app on the client side; a web server, an API application and a database (user profiles, auth credentials, audit logs) inside the system boundary; the email system and mainframe banking system outside it. Edges carry the protocol (HTTPS, JSON/HTTPS, JDBC, XML/HTTPS), which is the C4 convention at this level. Compare it with the context diagram above: same neighbours, but the system box has been opened.
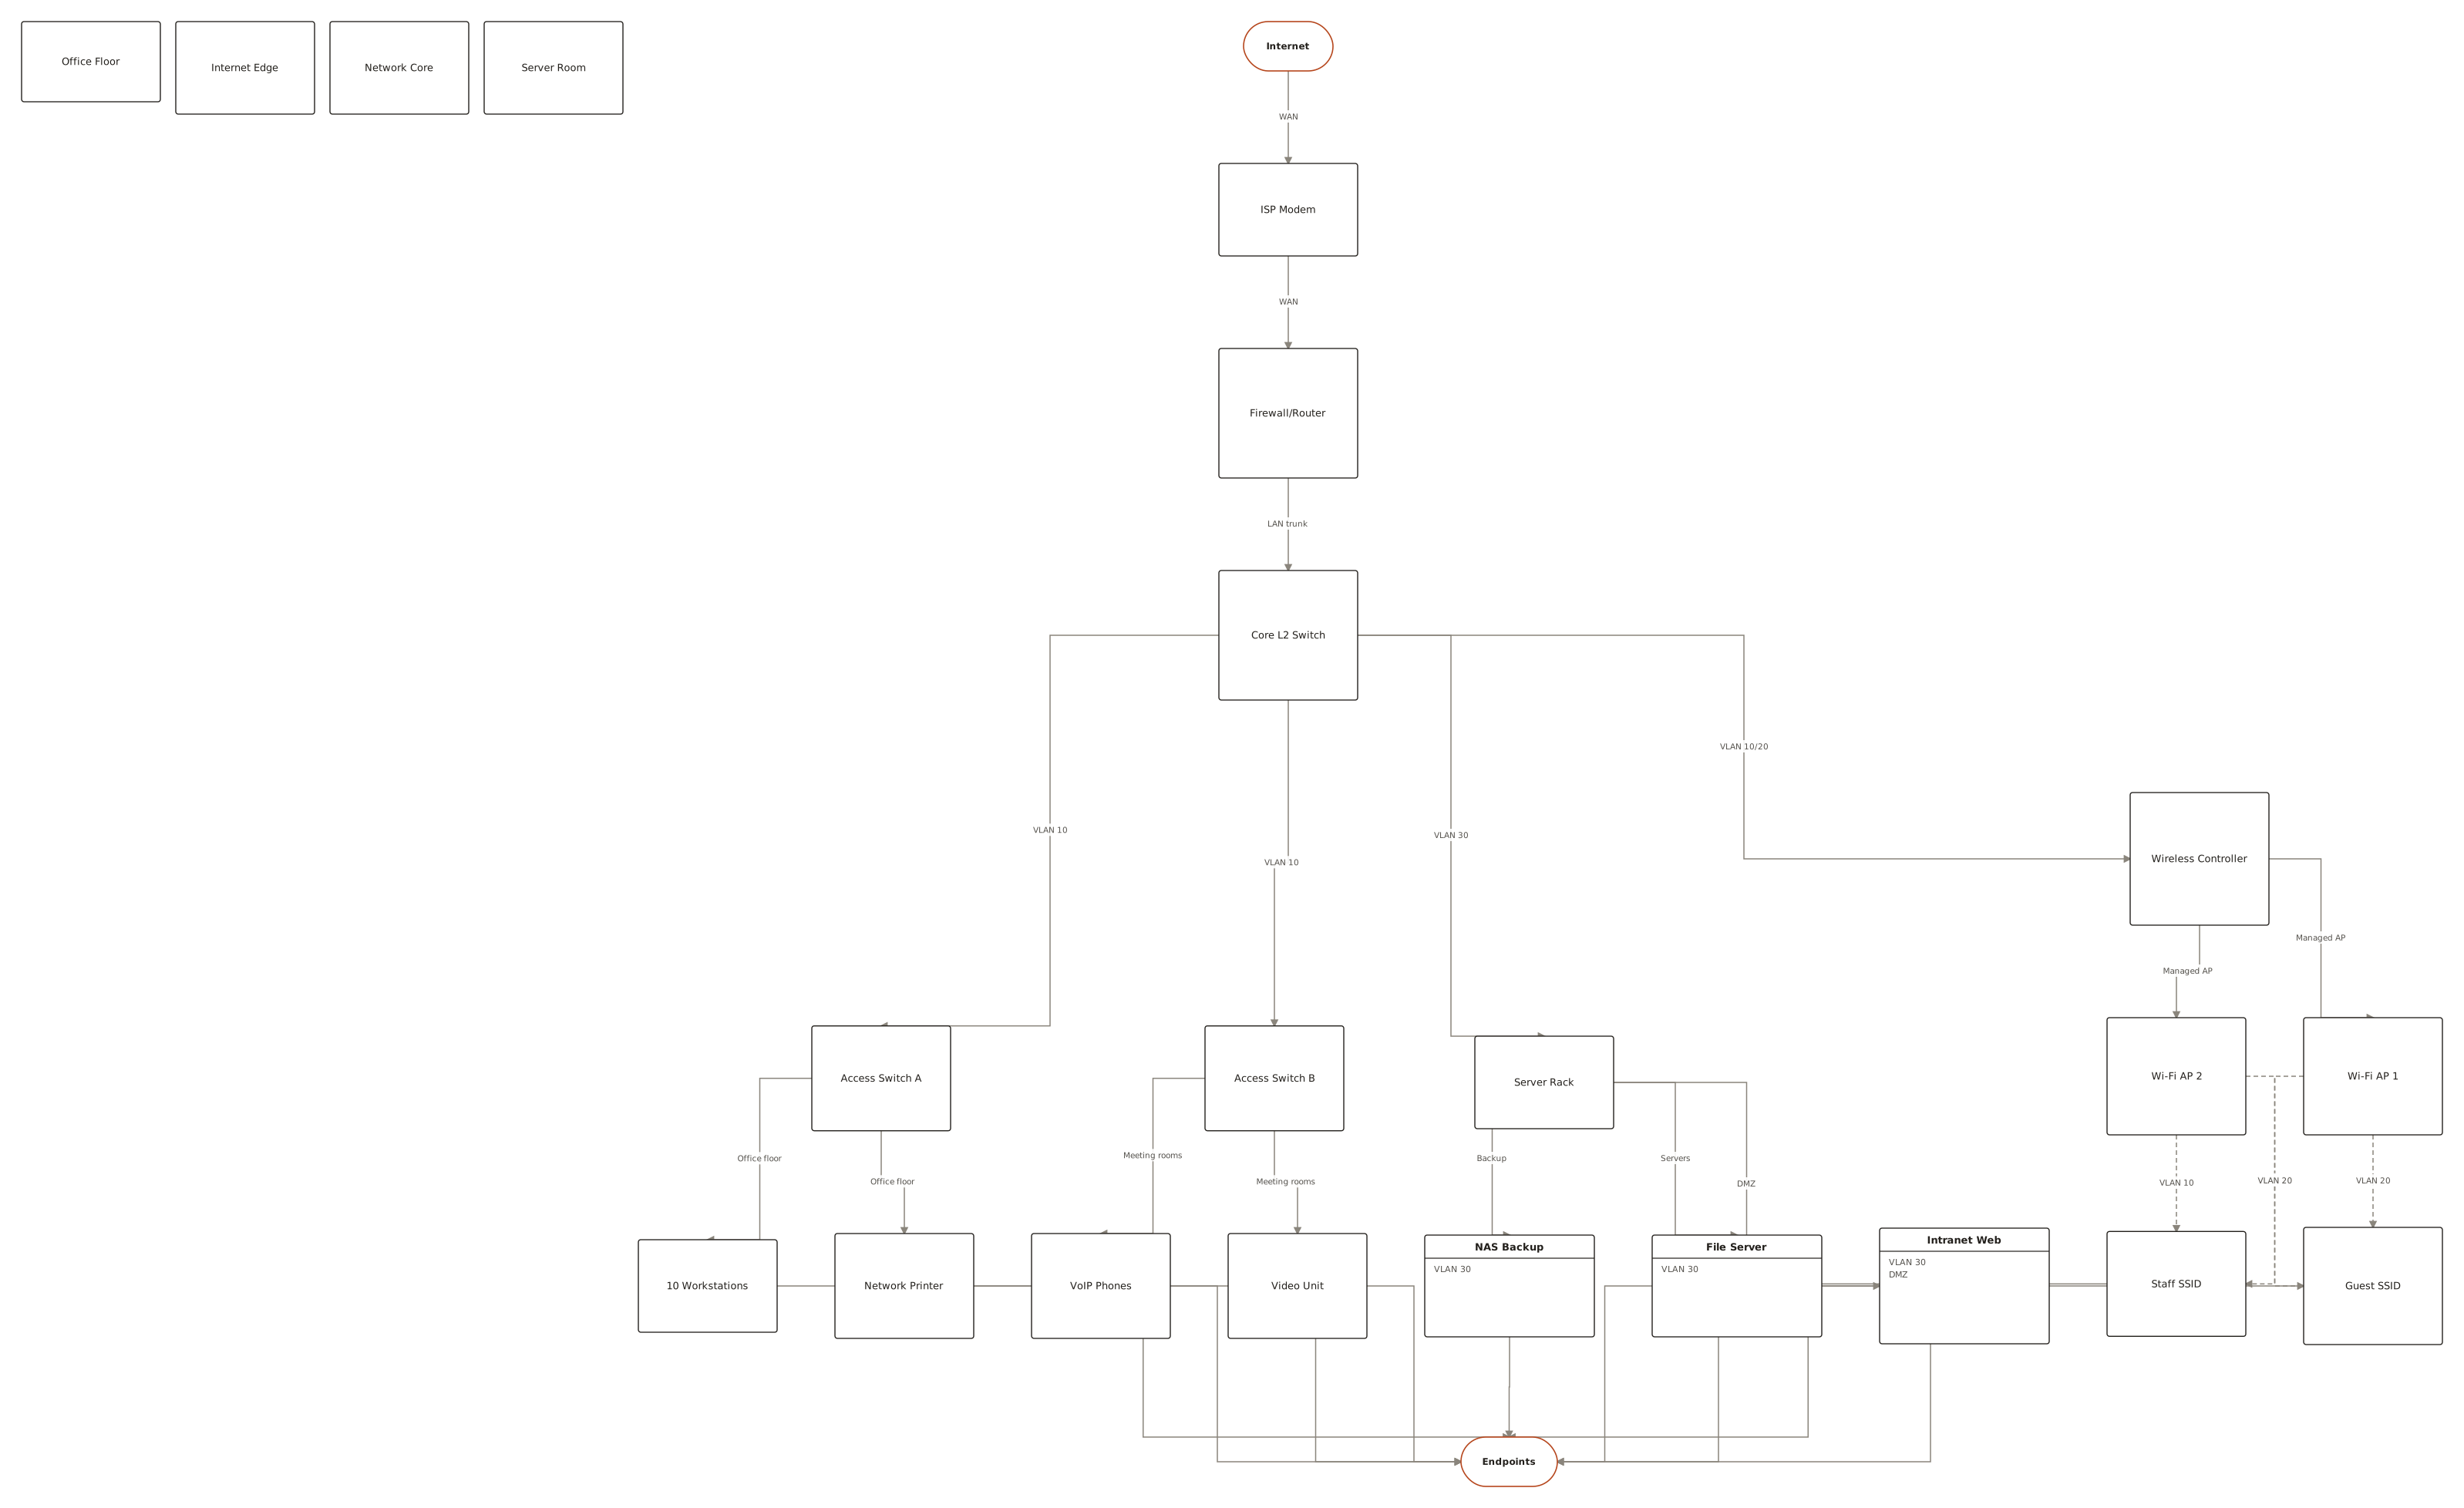
From the ISP modem through a firewall/router to a core switch, then two access switches for the office floor (workstations, printer, VoIP phones, video unit), a wireless controller with two access points carrying staff and guest SSIDs, and a server room with a file server, intranet web server, a DMZ and NAS backup. Edges are labelled with VLAN numbers and trunk links. Network diagrams are hierarchical top-down because the physical topology is: WAN edge, core, access, endpoints.
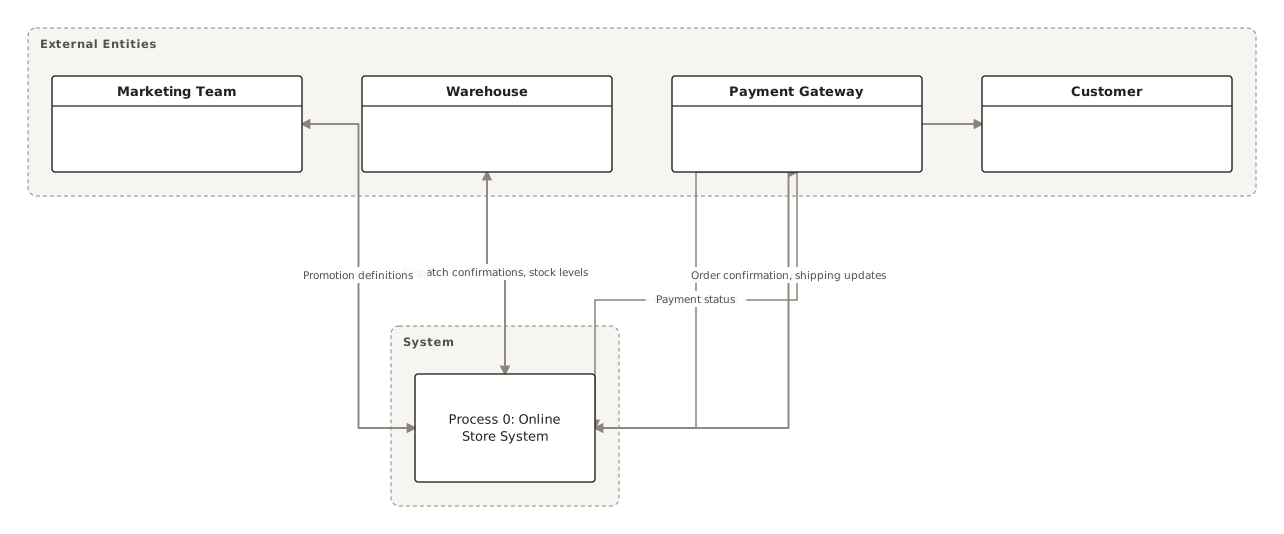
One process bubble (Process 0: Online Store System) surrounded by four external entities: customer, payment gateway, warehouse and marketing team. Every arrow is a named data flow — order details and payment info in, order confirmation and shipping updates out, charge requests and payment status, pick-and-pack instructions and dispatch confirmations, sales reports and promotion definitions. A level 0 DFD shows no internal structure at all; it is the data-centric cousin of the C4 context diagram and is decomposed into a level 1 DFD next.
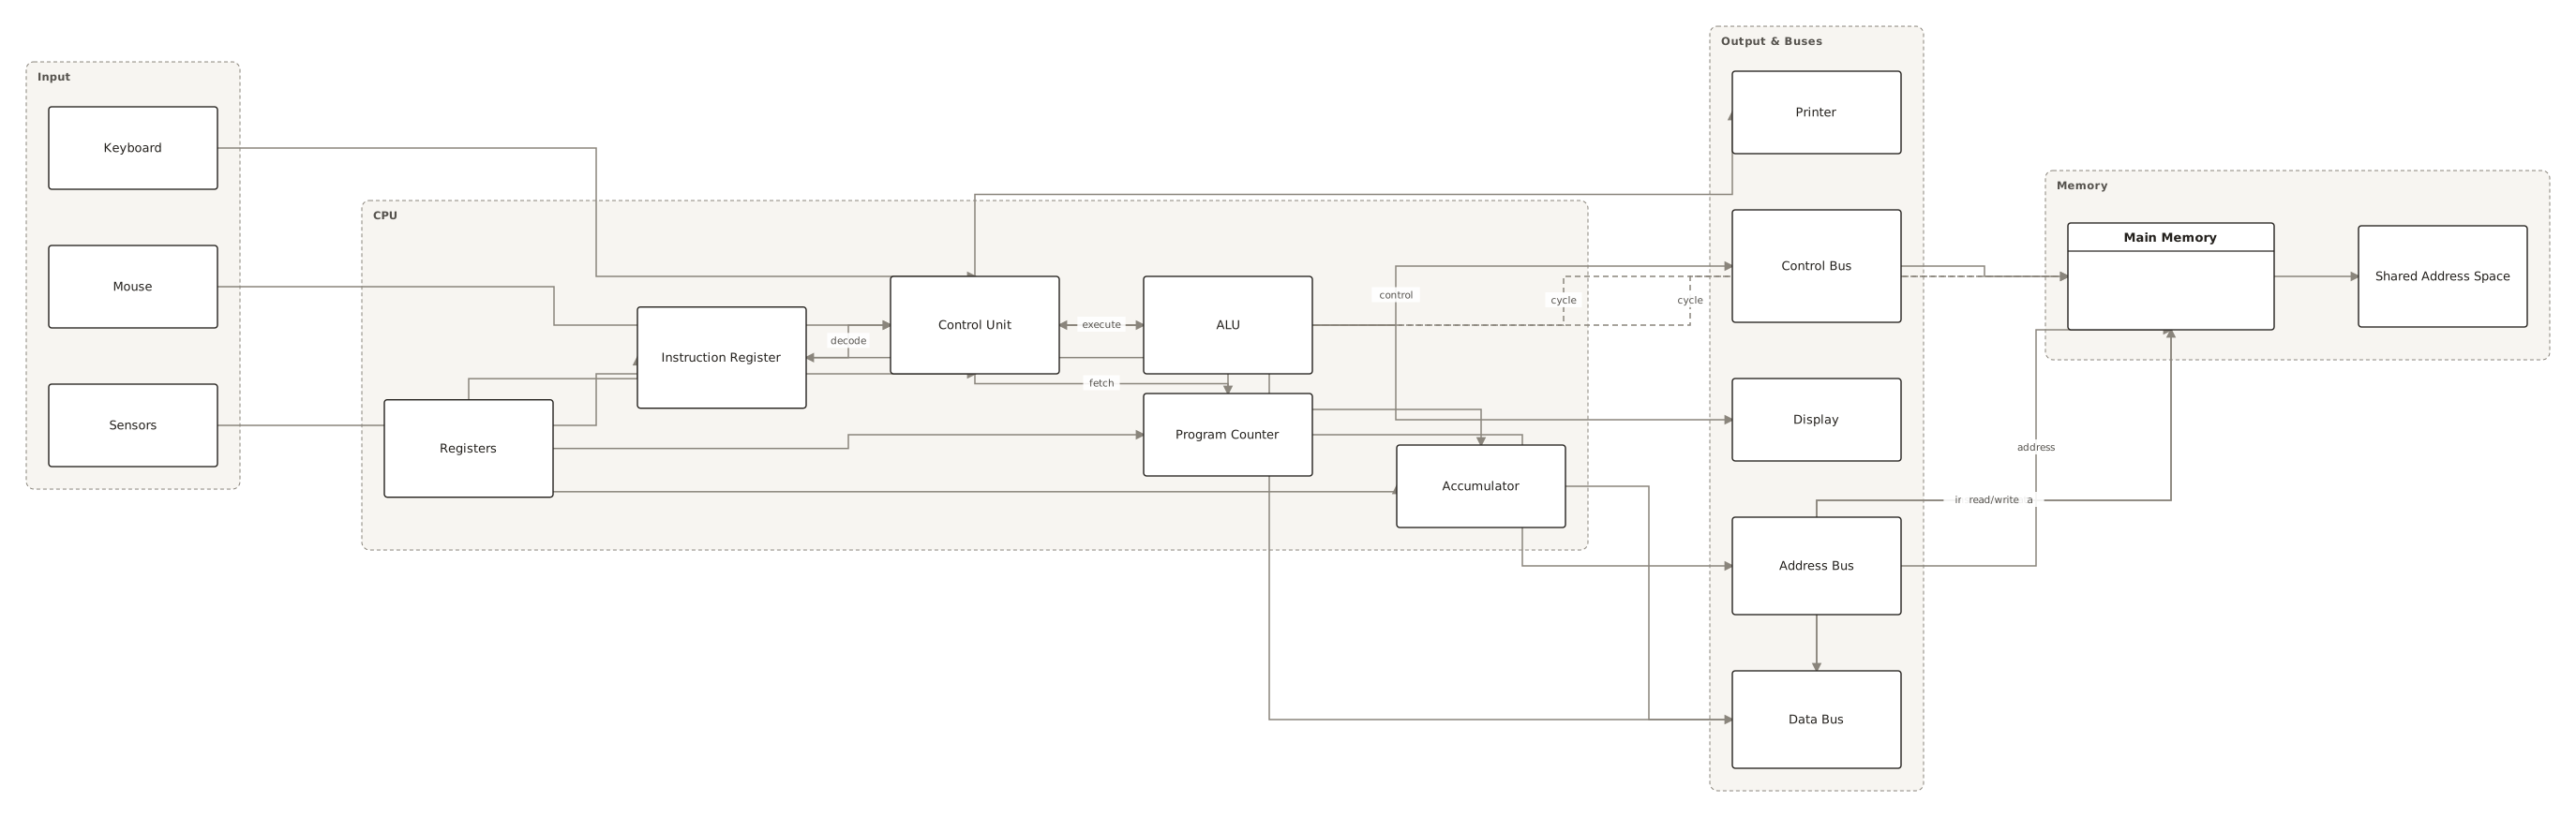
Input devices (keyboard, mouse, sensors), a CPU containing the control unit, ALU, program counter, instruction register, accumulator and general registers, a main memory with a shared address space for instructions and data, and output devices, all joined by the address, data and control buses. The fetch–decode–execute cycle is drawn as labelled edges between the control unit, memory and ALU. It is a block diagram rather than an architecture diagram: the boxes are functional units, the buses are the only connections, and no protocol or deployment detail belongs here.
Pick by the question the reader has. "What are the parts?" is a block diagram; "what calls what?" is an architecture diagram; "where does it run?" is a deployment diagram; "where does the data go?" is a data-flow diagram; "what are the cables and VLANs?" is a network diagram. C4 is a set of four zoom levels on an architecture diagram, from system context down to code.
Type
Boxes mean
Lines mean
Best for
Example above
Draw it
Block diagram
Functional units (CPU, memory, sensor)
Signals or buses, usually unlabelled
Hardware, control systems, first sketch of any system
Read the lanes first, then the edges that cross a lane boundary. Lanes (or tiers) are the author's grouping — client, platform, data, external — and most of the information is in which group a box belongs to. Edges that cross a boundary are the integration points, and they are the ones that carry a protocol label.
Three conventions hold across all ten examples. First, flow runs left to right or top to bottom, so the entry point (user, device, request) is always on the left or at the top. Second, external systems are drawn outside the main boundary and usually in the last lane, so you can count dependencies at a glance. Third, asynchronous paths (queues, event buses, replication) are drawn as separate labelled edges rather than folded into the request path, because they fail differently. If a diagram you are reading breaks these rules, that is a signal, not a style choice.
Why are system diagrams laid out in lanes?
Because a system has two structures at once: a hierarchy (which tier owns what) and a graph (what connects to what). Lanes carry the hierarchy, edges carry the graph, and the reader can follow either without losing the other. ChartCraft's layout engine (ELK) places lanes as columns and routes edges orthogonally so crossings stay minimal even with twenty nodes.
The practical rules: one lane per tier or ownership boundary (never more than five); each lane sorted so that upstream nodes sit above downstream ones; external systems in their own lane; databases drawn as cylinders so storage is distinguishable from compute; and every edge that crosses a lane labelled with the protocol or the data it carries. The architecture diagram generator applies these rules automatically from a prompt such as "a three-tier web app with a CDN, two API servers behind a load balancer, Redis and PostgreSQL with a read replica, Stripe for payments".
From prompt to diagram
Every example above started as a paragraph. A good system-diagram prompt names (1) the lanes, (2) the boxes in each lane, (3) the edges with their protocol and (4) which systems are external. That is also a decent definition of done for the diagram itself.
Frequently asked questions
What is a system diagram?
A system diagram is any drawing that shows the components of a system and how they connect. In software the common forms are the architecture diagram (services and data stores), the deployment diagram (where things run), the C4 model (four zoom levels), the data-flow diagram (where data goes) and the network diagram (physical and logical links). In engineering the simplest form is the block diagram.
What is the difference between a system diagram and an architecture diagram?
"System diagram" is the umbrella term; an architecture diagram is one kind of system diagram, the kind that shows software components (services, apps, databases, queues) and the calls between them. A block diagram, a network diagram and a DFD are also system diagrams but are not architecture diagrams.
What is the difference between a C4 context diagram and a container diagram?
A context diagram (C4 level 1) treats the system as a single box and shows only its users and neighbouring systems. A container diagram (C4 level 2) opens that box and shows the deployable units inside it — web app, API, database — and the protocols between them. The two internet-banking examples above are the same system at both levels.
Which system diagram should I draw first?
A C4 system context diagram or a level 0 DFD. Both force you to name the boundary and every external party before you draw anything inside, and both fit on one screen. Then open the box with a container or architecture diagram.
How many boxes should a system diagram have?
Fewer than about twenty on one page. The examples above range from five (C4 context) to twenty-two (ride-sharing). Beyond that, split by zoom level (C4) or by subsystem, and link the diagrams rather than cramming them.
Should edges be labelled?
Label every edge that crosses a boundary (lane, tier, system) with the protocol or the data it carries — HTTPS, JDBC, MQTT, "events", "order details". Edges inside a lane can stay unlabelled if the direction is obvious. Unlabelled cross-boundary edges are the most common defect in architecture diagrams.
Can I generate a system diagram from text?
Yes. Every example on this page was generated by ChartCraft from a plain-English description; open any card to see the prompt. The architecture diagram generator, C4 diagram generator, network diagram generator and data flow diagram generator each take a paragraph and lay the diagram out automatically.
 Architecture · layered (3-tier)