How-to
How to make a flowchart from a description
How to make a flowchart in seconds: describe the process in plain English and let ChartCraft draw and lay out the decisions and branches. Free to try.
Step by step
01Pin the boundaries
Name the event that starts the process and every outcome that ends it. “Ticket arrives” → “Ticket closed”. If you can't name the end states, the middle will sprawl.
02List the steps as verbs
Write each action as a short verb phrase in the order it happens: classify, assign, resolve, notify. Don't worry about shapes yet — order first.
03Find the questions
Wherever the path forks, phrase the fork as a question with mutually exclusive answers (“Urgent?” yes/no) and give every branch a label.
04Walk every path
Trace each branch from Start until it reaches an End. Dead-ends and branches that silently rejoin the wrong step are the two most common flowchart bugs.
05Generate and refine
Describe the process in plain English in the studio and ChartCraft draws and lays it out; ask for changes (“add a retry after payment”) until it reads cleanly, then export SVG or PNG.
From sentence to flowchart, in three passes
The fastest way to a good flowchart is to grow it: start with the spine, then add the guards and the endings. Here's a refund process built exactly that way.
Pass 1 · You type
A customer requests a refund. Support reviews the request and either approves or rejects it.
Pass 1 is the spine: one trigger, one decision, one ending per outcome. Resist detail here — everything else will hang off this skeleton.
Pass 2 · You add
Before review, check the order is within the 30-day window — outside the window it's auto-rejected.
Guards go in front. An early decision keeps invalid cases from ever reaching the expensive step, and the chart now documents the policy, not just the mechanics.
Pass 3 · You finish
After the refund is processed, email a confirmation; on any rejection, email the reason.
Symmetric endings. Every path now tells the customer what happened before it terminates — the classic gap in process charts is the silent rejection. Export as SVG or PNG and you're done.
Best practices — and the classic mistakes
Do
- Flow one direction — top-to-bottom for processes, left-to-right for timelines; never both in one chart.
- Label every branch out of a decision, even when it feels obvious.
- Keep one chart to roughly 15–25 nodes; split anything bigger into a parent chart with subprocess boxes.
- Start labels with verbs (“Verify email”), decisions with questions (“Profile complete?”).
- One Start. Multiple Ends are fine — one per distinct outcome.
Avoid
- Unlabelled branches — a diamond with two bare arrows forces every reader to guess.
- Dead ends — a path that never reaches an End terminator usually means a forgotten failure case.
- Mixed altitude — “Submit form” next to “TCP handshake” in the same chart. Pick one level of detail.
- Decisions drawn as processes — if the box implies a choice, it should be a diamond with labelled exits.
The notation, in 30 seconds
Six shapes cover almost every flowchart you'll ever draw — the full set of 21 is in our flowchart symbols guide.
| Element | What it means |
|---|---|
| Terminator (rounded rectangle) | Where the flow starts and ends. One Start, at least one End. |
| Process (rectangle) | A single step that does something — verb first: “Validate input”, “Send receipt”. |
| Decision (diamond) | A question with labelled exits — Yes/No, or one exit per case. |
| Flowline (arrow) | The order of execution. Keep it flowing one direction: top-to-bottom or left-to-right. |
| Input/Output (parallelogram) | Data entering or leaving: read a form, print a report, write a file. |
| Connector (circle) | A labelled jump that avoids drawing long lines across the page. |
Worked flowchart examples
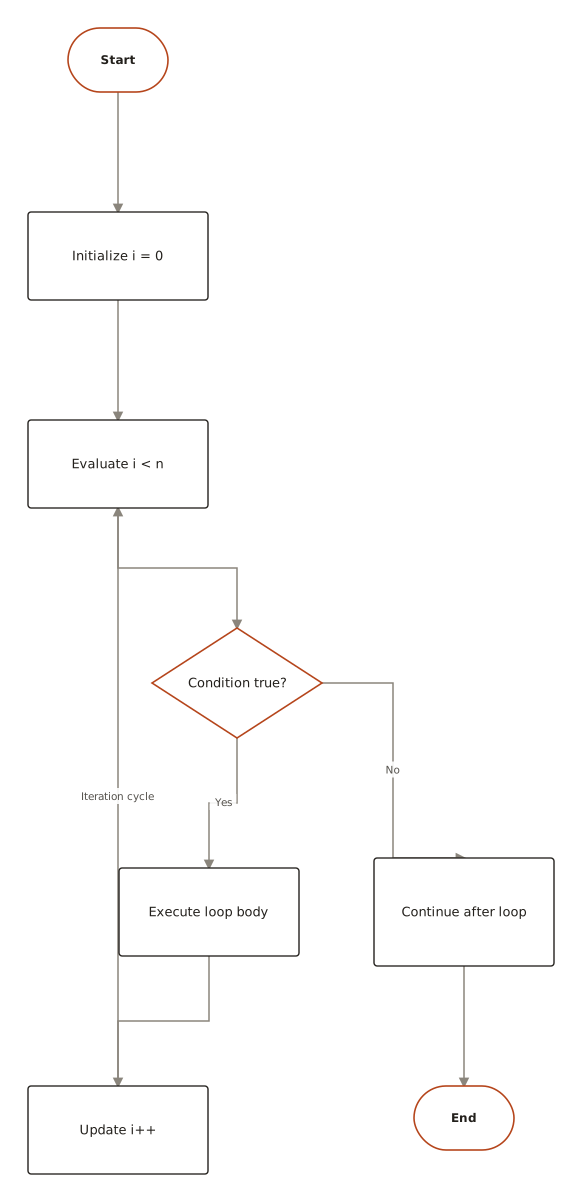
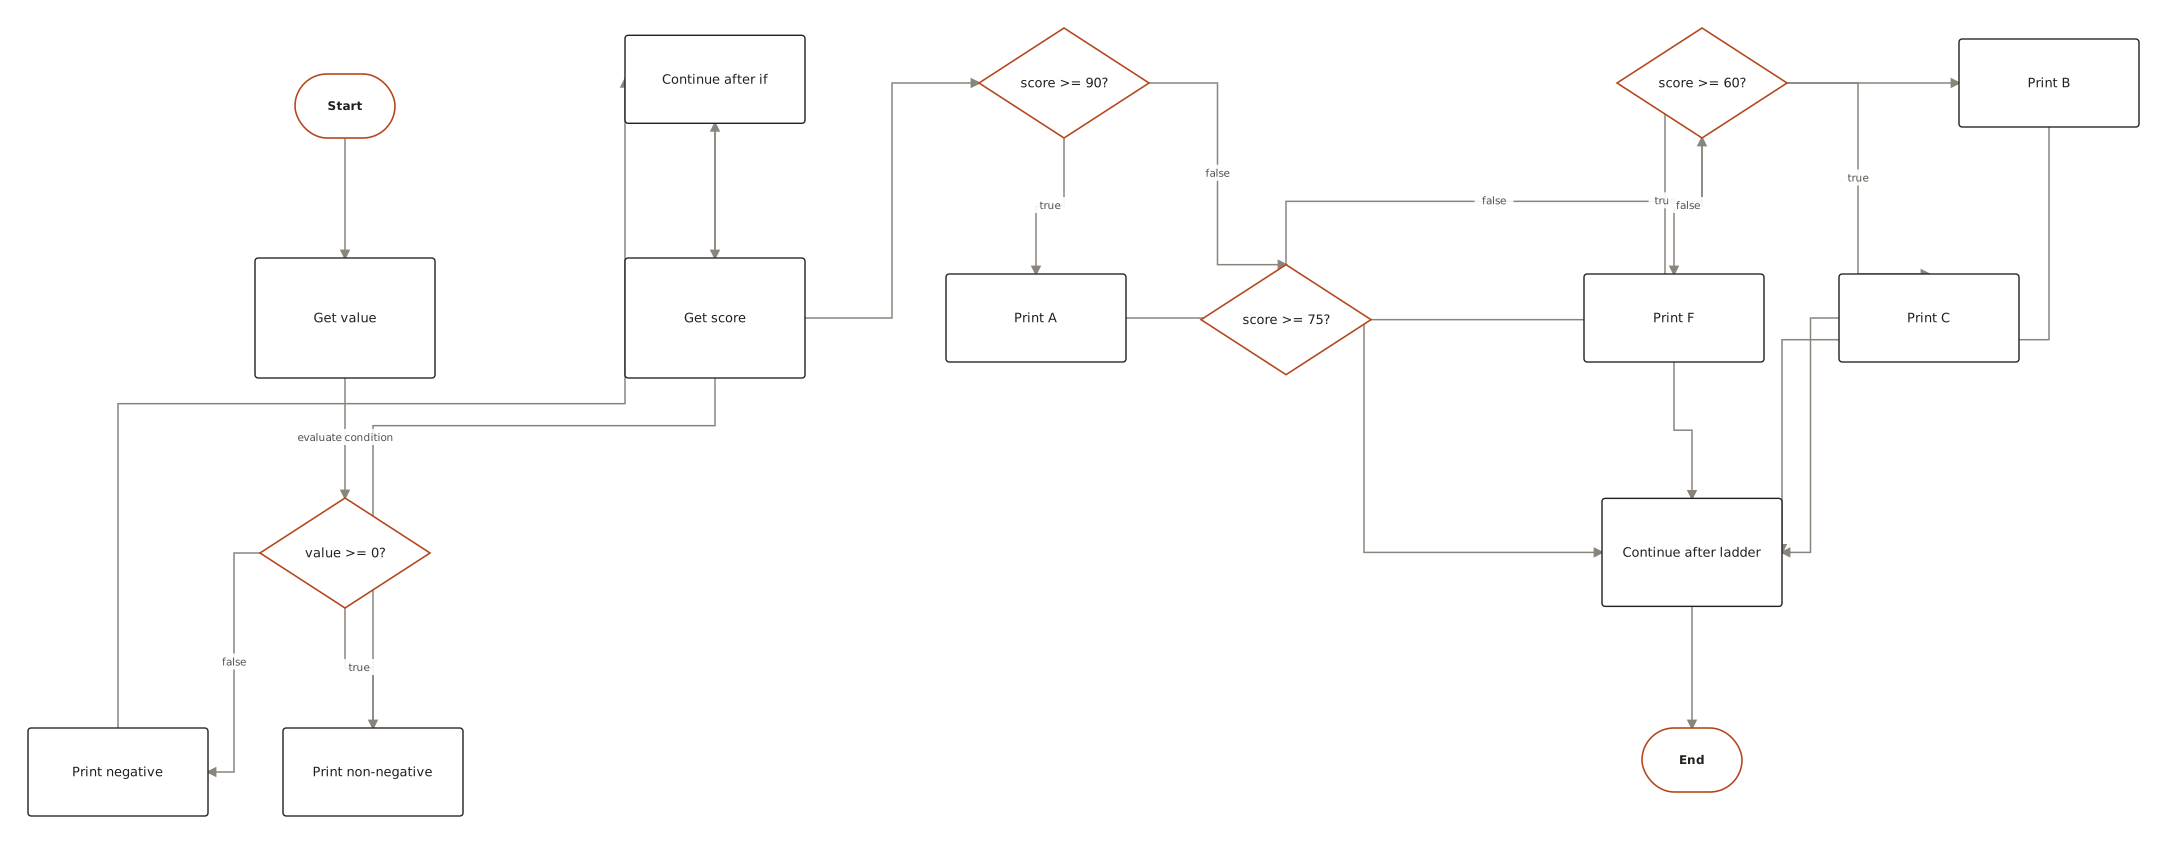
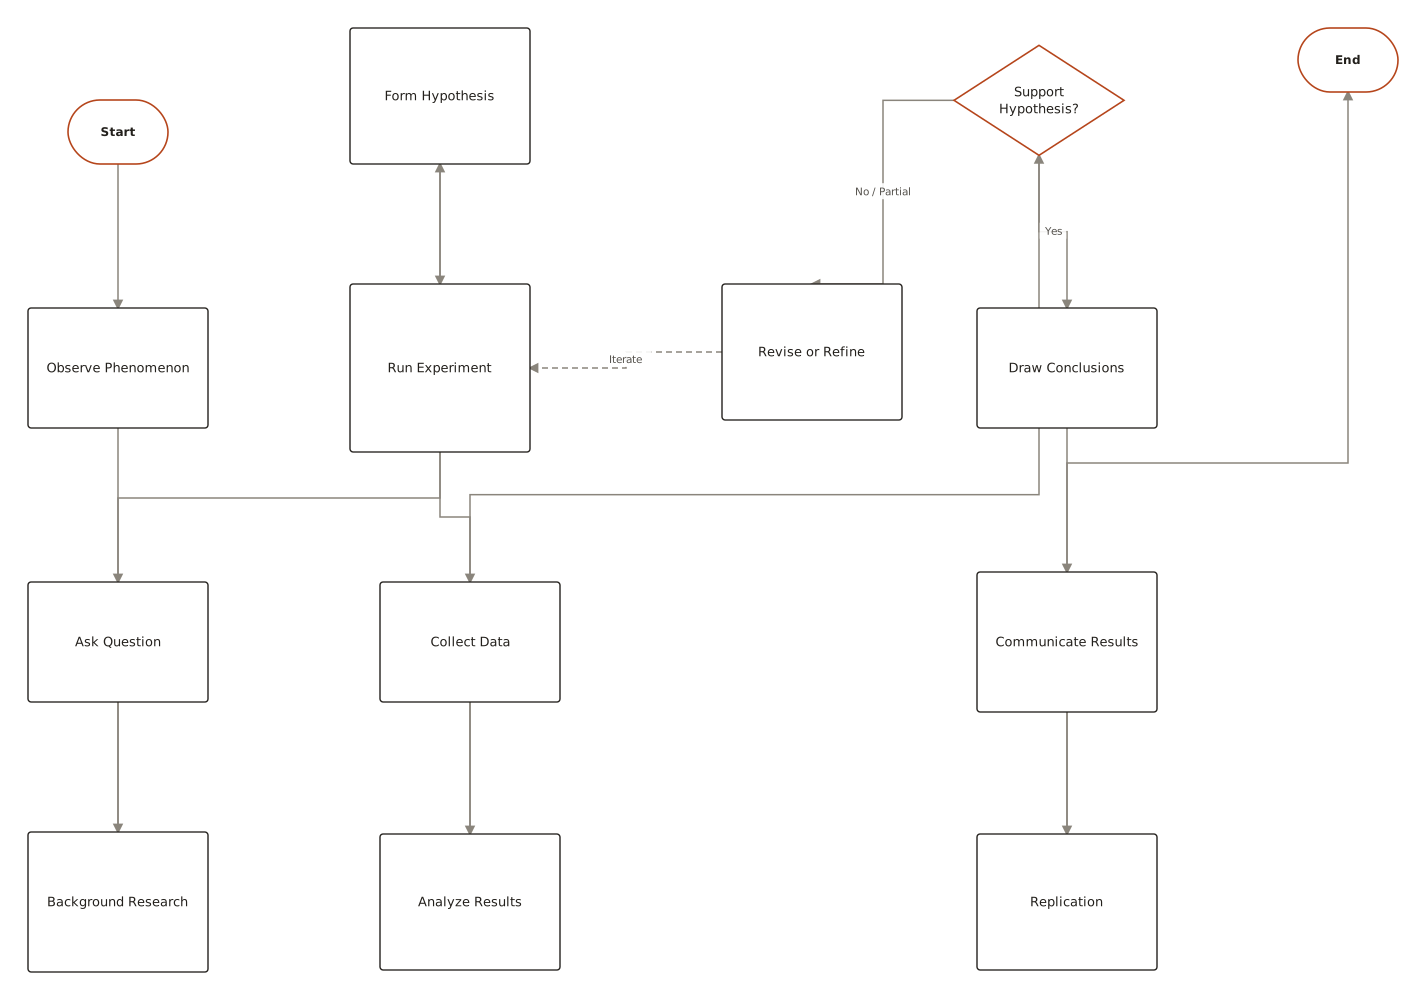
Generated with ChartCraft and published in the examples gallery — open one to see its prompt, or use it as a starting point.
Questions
What's the fastest way to make a flowchart?
Describe it in plain English. ChartCraft parses your description, builds the flowchart, and runs an automatic layout so you don't place or connect anything by hand.
Do I need to know any diagram syntax?
No. You write a normal sentence or two; ChartCraft handles the notation and layout.
How many symbols do I actually need to know?
Six: terminator, process, decision, flowline, input/output, and connector. The other fifteen exist for specialised charts — see the flowchart symbols guide for the complete set with meanings.
When should I split a flowchart into two?
Past roughly 25 nodes, or when two audiences need different detail. Replace the detailed section with a predefined-process box and give it its own chart.
Can I export the result?
Yes, export to SVG or PNG on any plan, including the free tier.