Reference · Data flow diagrams
Data flow diagram symbols: Yourdon–DeMarco vs Gane–Sarson
In short
A data flow diagram (DFD) uses only four symbols: the external entity (a rectangle — a person, department or system outside the scope that sends or receives data), the process (a circle in Yourdon–DeMarco notation, a rounded rectangle with a numbered header in Gane–Sarson — work that transforms incoming data into outgoing data), the data store (two parallel lines, or an open-ended rectangle with a D1-style code — data at rest) and the data flow (a labelled arrow — data in motion). The two notations differ only in how the shapes are drawn; the rules are identical. A context diagram uses a single process; each lower level decomposes one process from the level above.
Updated · by the ChartCraft team · Simbol DFD (Bahasa Indonesia)
What are the four DFD symbols in each notation?
Both notations have exactly the same four elements. Yourdon–DeMarco (Tom DeMarco, Structured Analysis and System Specification, 1978, building on Ed Yourdon's work) draws processes as circles; Gane–Sarson (Chris Gane and Trish Sarson, Structured Systems Analysis, 1979) draws them as rounded rectangles with a numbered top band. Pick one and keep it consistent across every level of the diagram.
| Yourdon–DeMarco | Gane–Sarson | Element | What it means | Naming rule |
|---|---|---|---|---|
| Process | Work that transforms input data into output data: validate an order, calculate pay, generate a report. Numbered 1.0, 2.0 … at the first level and 1.1, 1.2 … below. | Verb + object: "Validate order", not "Order validation" | ||
| External entity (terminator, source/sink) | A person, organisation or other system outside the boundary of the system being modelled that supplies data to it or receives data from it: Customer, Bank, Payroll system. Gane–Sarson often draws it with a drop shadow. | Singular noun: "Customer", not "Customers" | ||
| Data store | Data at rest that a process reads or writes: a file, a database table, a ledger, even a filing cabinet. Labelled D1, D2 … so that the same store can be repeated anywhere in the diagram. | Plural noun: "D1 Orders" | ||
| Data flow | Data in motion between two elements. The label names the data, not the action: "order details", "payslip". A flow has one direction; draw two arrows (or a double-headed arrow for a read-and-update of a store) when data travels both ways. | Noun phrase: "payment confirmation" |
Two secondary marks you will meet in Gane–Sarson diagrams: a diagonal line in the corner of an external entity or data store means duplicate — the same element drawn again elsewhere to avoid long crossing arrows.
| Symbol | Name | Meaning |
|---|---|---|
| Duplicated external entity | The same entity drawn a second time to keep arrows short. Mark every copy. | |
| Duplicated data store | Same idea for a data store that several processes use. | |
| Two-way data flow | A process that reads a record and writes it back. Many analysts prefer two separate labelled arrows. |
What is a data flow diagram?
A data flow diagram shows where data comes from, which processes transform it, where it is stored and where it ends up — and nothing else. It deliberately leaves out sequence, timing and decisions; those belong in a flowchart or a BPMN process. DFDs are the core model of structured analysis (DeMarco 1978; Gane & Sarson 1979) and are still the standard way to scope a system before designing its database or its screens.
What is the difference between Yourdon–DeMarco and Gane–Sarson notation?
Only the drawing conventions differ. Yourdon–DeMarco uses circles for processes and a pair of parallel lines for data stores; Gane–Sarson uses rounded rectangles with a numbered header and an open-ended rectangle with a code box. Meaning, numbering, levelling and balancing rules are the same in both, so a diagram can be redrawn from one to the other without losing anything.
| Aspect | Yourdon–DeMarco | Gane–Sarson |
|---|---|---|
| Process | Circle ("bubble"), number inside or above the name | Rounded rectangle, number in a top band |
| External entity | Plain rectangle | Rectangle, often with a drop shadow |
| Data store | Two horizontal parallel lines, code at the left | Open-ended rectangle with a boxed code (D1) |
| Data flow | Labelled arrow, often curved | Labelled arrow, usually straight or orthogonal |
| Duplicate marks | Not defined | Diagonal line in the corner of entities and stores |
| Where you will see it | Textbooks, CASE tools from the DeMarco/Yourdon school, most Mermaid/PlantUML approximations | SSADM, Visio's "Gane-Sarson" stencil, many university courses |
What are DFD levels — context, level 0, level 1 and level 2?
DFDs are drawn as a hierarchy. The context diagram shows the whole system as one process with every external entity around it. Level 0 explodes that single process into the system's major processes (1.0, 2.0, 3.0 …) and introduces the data stores. Level 1 explodes one of those processes into sub-processes (1.1, 1.2 …); level 2 goes one step further (1.1.1 …). Stop when a process can be described in a short paragraph or a few lines of pseudocode — most systems need two or three levels.
| Level | What it shows | Process numbering | Data stores | Live example |
|---|---|---|---|---|
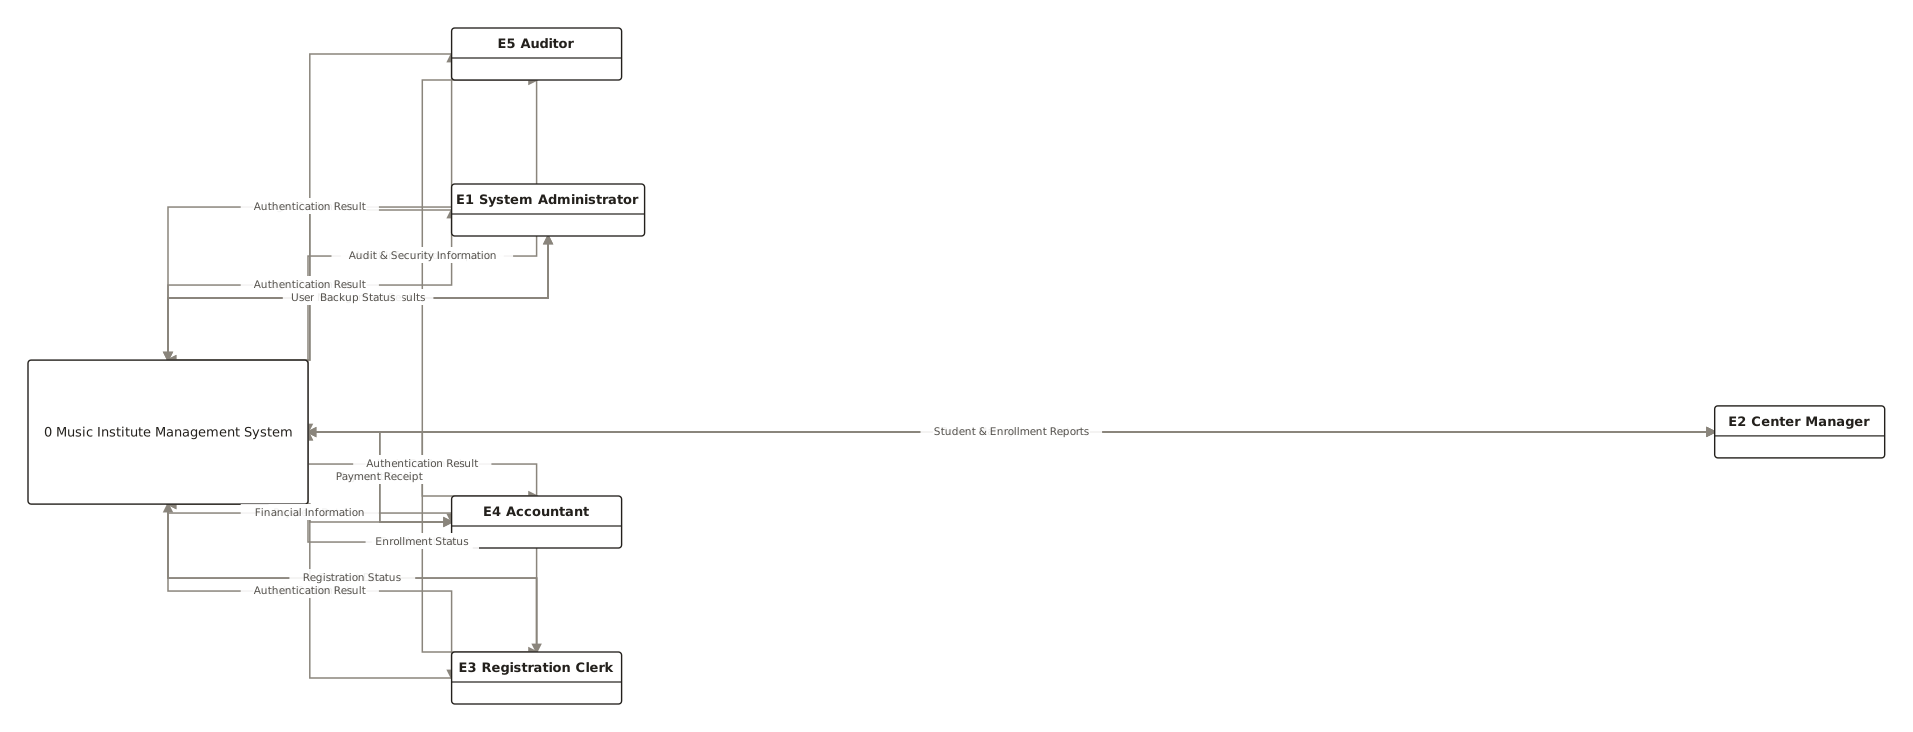
| Context diagram | The entire system as one process, all external entities, and the flows between them | 0 | Not shown (the whole system is the black box) | Music institute management system |
| Level 0 | The major processes of the system and the data stores they share | 1.0, 2.0, 3.0 … | Introduced here | Online store |
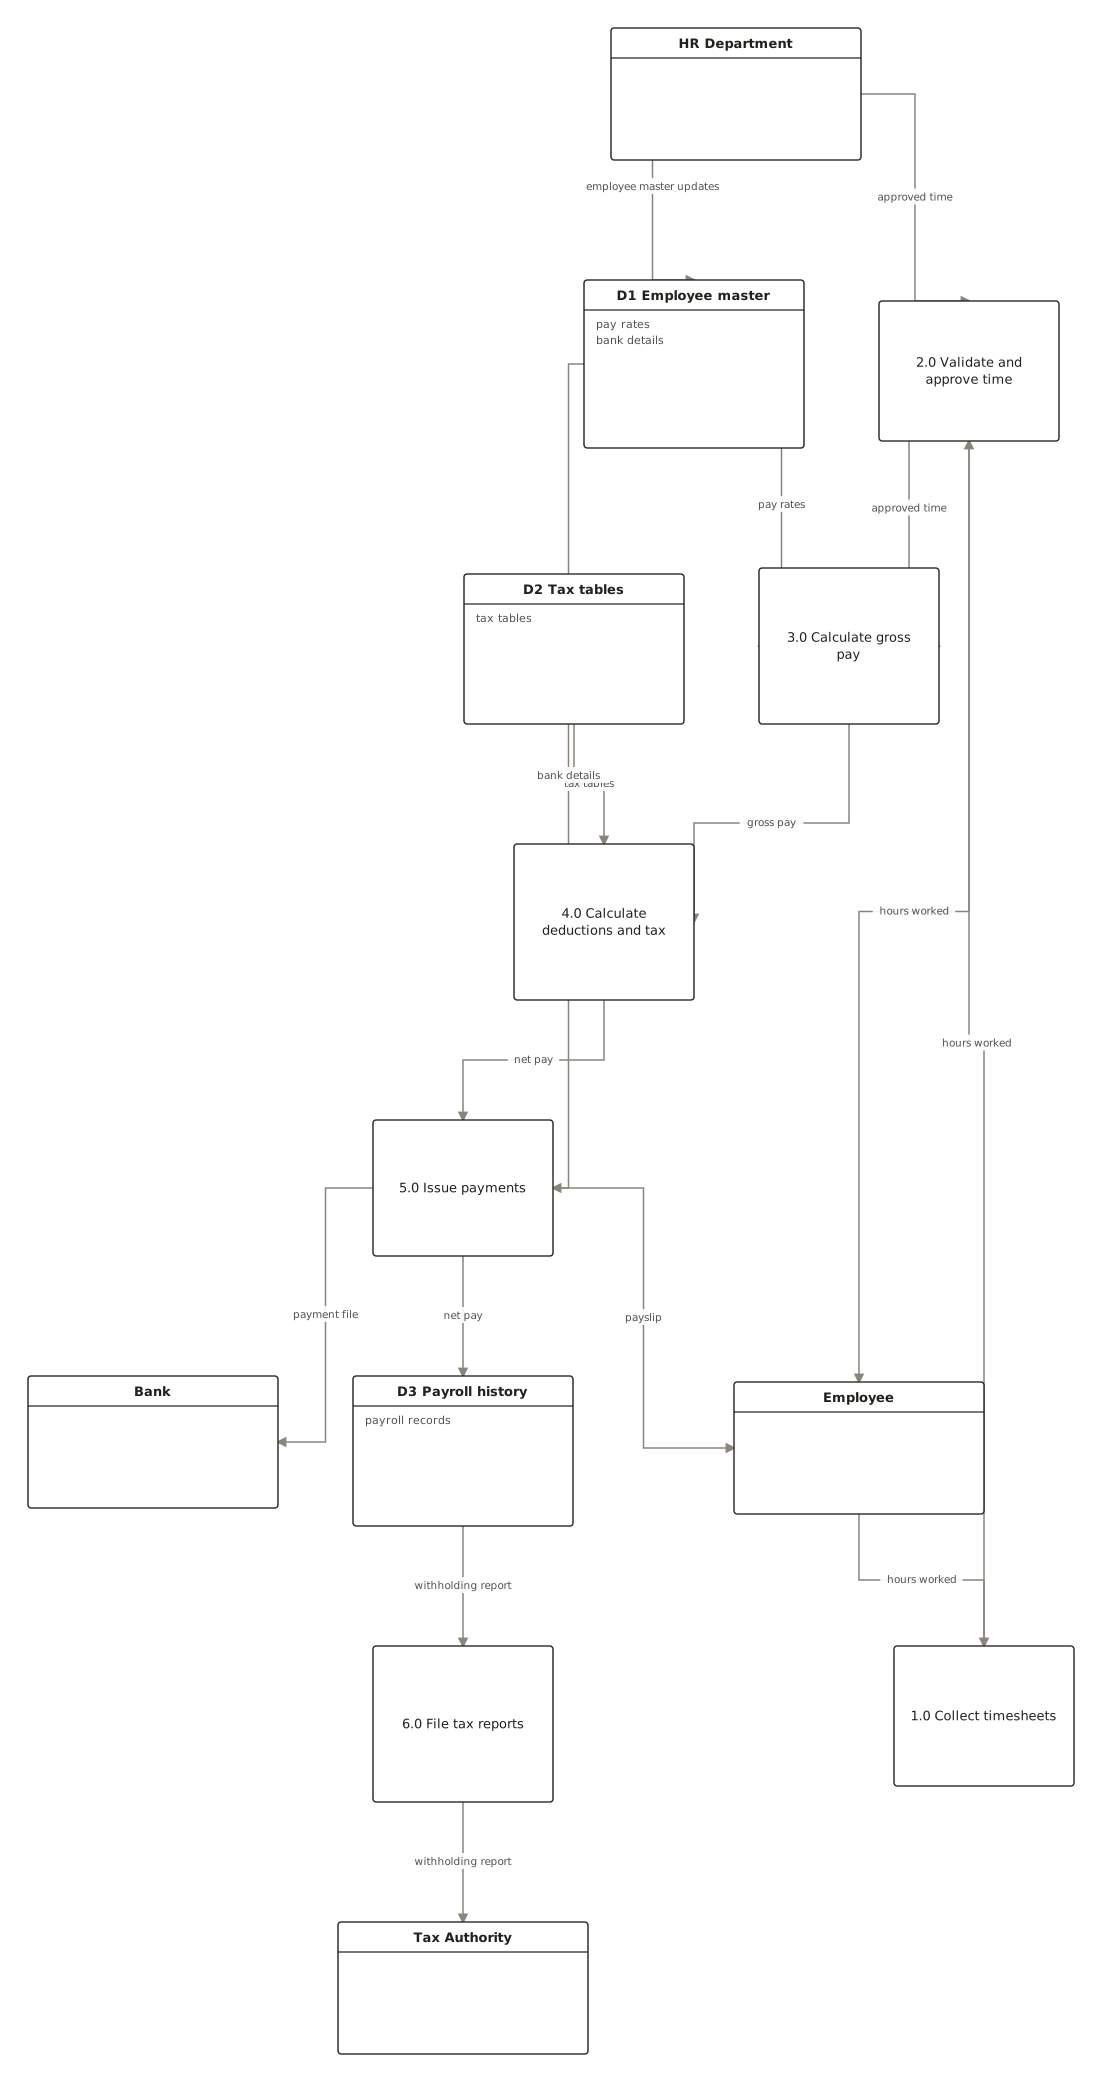
| Level 1 | One level-0 process broken into sub-processes | 1.1, 1.2, 1.3 … | Stores from level 0 plus any that are local to this process | Payroll system |
| Level 2 | One level-1 process broken down further; rarely needed | 1.1.1, 1.1.2 … | As above | — |
Numbering conventions vary between textbooks: some call the context diagram "level 0" and the first decomposition "level 1". Whatever your course or team uses, the rule that matters is that every child diagram balances with its parent.
What are the balancing rules for a levelled DFD?
A child diagram must have exactly the same inputs and outputs as the process it explodes: every data flow entering or leaving process 2.0 on level 0 must appear, with the same name, on the level-1 diagram of process 2.0. Data stores that only one process uses can first appear inside that process's child diagram; stores shared by two or more processes must appear at the level where both processes are visible.
- Same boundary flows. Flows crossing the edge of a child diagram = flows attached to the parent process. A flow may be split into its components on the child ("customer details" → "name", "address") if the data dictionary defines it that way.
- Every process has at least one input and one output. A process with inputs only is a black hole; outputs only is a miracle.
- Every flow touches a process. Entity → entity, entity → store and store → store flows are not allowed: something must do the work.
- Numbering descends. Children of 2.0 are 2.1, 2.2 …; children of 2.1 are 2.1.1, 2.1.2 …
- 7 ± 2 processes per diagram. More than about nine is a sign to add a level.
- One notation, one direction. Do not mix circles and rounded rectangles, and label every arrow.
What are the most common DFD mistakes?
Most errors are either an illegal flow (one that skips a process) or a process whose inputs cannot produce its outputs. The table lists the ones reviewers see most often.
| Mistake | Why it is wrong | Fix |
|---|---|---|
| Black hole | A process with inputs but no outputs — the data disappears. | Add the output, or remove the process. |
| Miracle | A process with outputs but no inputs — data appears from nowhere. | Add the input that the output is derived from. |
| Grey hole | The inputs cannot plausibly produce the outputs ("customer id" in, "annual report" out). | Add the missing inputs or split the process. |
| Entity-to-entity flow | Data moving between two external entities is outside the system. | Delete it, or add the process that handles it. |
| Store-to-store or entity-to-store flow | Only a process can read or write a store. | Route the flow through a process. |
| Unlabelled or verb-labelled flow | "Send" is an action; a flow carries data. | Label with the data name: "invoice". |
| Control flow drawn as data flow | "Approved?" or "error" arrows describe decisions, not data. | Leave decisions to the process description or a flowchart. |
| Unbalanced child diagram | The level-1 diagram has flows the parent process does not. | Add them to the parent or remove them from the child. |
| Process named with a noun | "Order" is a thing; a process does something. | Verb + object: "Validate order". |
What does a complete DFD look like?
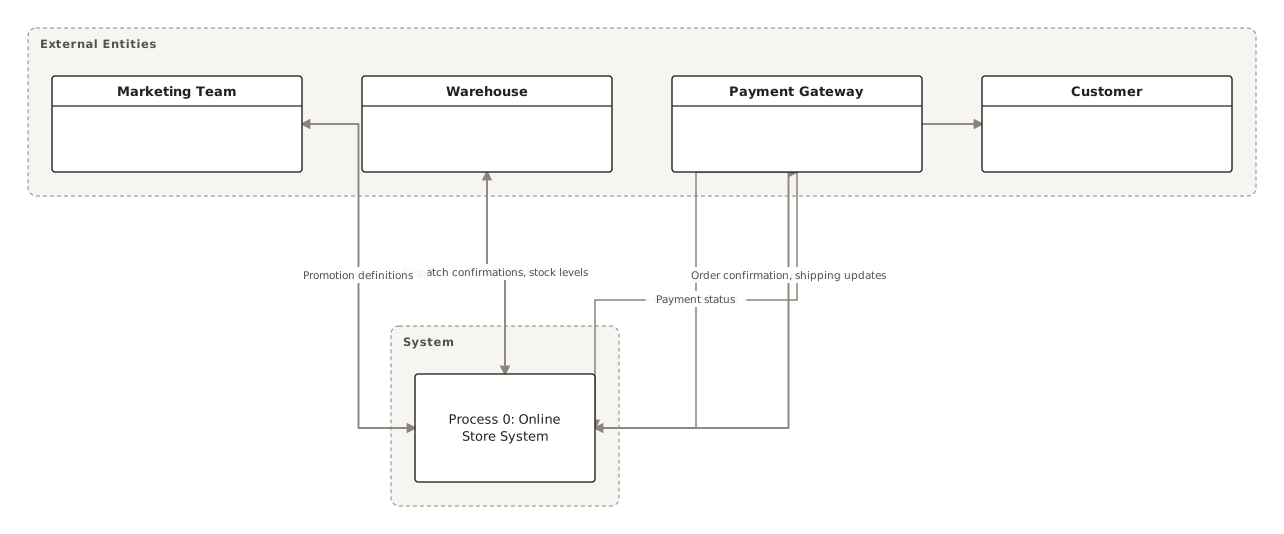
Below is a level-0 data flow diagram for an online store from the ChartCraft gallery, followed by the same kind of diagram written in Mermaid. In Mermaid, double parentheses give a Yourdon–DeMarco process circle, [( )] gives a cylinder that most people accept as a data store, and -->|label| names each flow.
flowchart LR
    E1[Customer]
    E2[Bank]
    P1((1.0 Take order))
    P2((2.0 Process payment))
    D1[(D1 Orders)]
    D2[(D2 Payments)]
    E1 -->|order details| P1
    P1 -->|new order| D1
    P1 -->|invoice| P2
    E1 -->|payment| P2
    P2 -->|authorisation request| E2
    E2 -->|authorisation result| P2
    P2 -->|payment record| D2
    P2 -->|order confirmation| E1
DFD vs flowchart vs BPMN — which one do I need?
Use a DFD when the question is "what data moves where and where is it kept?"; use a flowchart when the question is "what are the steps and where does the logic branch?"; use BPMN when the question is "who does what, in what order, across which departments?".
| Data flow diagram | Flowchart | BPMN | |
|---|---|---|---|
| Shows | Data movement, stores, external parties | Sequence of steps and decisions | Business process with roles, events and gateways |
| Time and order | No | Yes | Yes |
| Decisions | No (inside a process) | Diamond | Gateway |
| Who does it | No (external entities only) | Optional swimlanes | Pools and lanes |
| Standard | DeMarco 1978; Gane–Sarson 1979 | ISO 5807 | OMG BPMN 2.0 |
| Reference | This page | Flowchart symbols | BPMN symbols |
What do real diagrams with these symbols look like?
Live diagrams from the public ChartCraft gallery, each generated from a plain-English description — open one to see the prompt that produced it.
Questions
What are the 4 symbols of a data flow diagram?
External entity (rectangle), process (circle in Yourdon–DeMarco, rounded rectangle in Gane–Sarson), data store (two parallel lines or an open-ended rectangle) and data flow (a labelled arrow).
What is the difference between Gane-Sarson and Yourdon-DeMarco?
Only the shapes. Gane–Sarson draws processes as rounded rectangles with a numbered header and data stores as open-ended rectangles with a code; Yourdon–DeMarco draws processes as circles and data stores as two parallel lines. Rules, levels and balancing are identical.
What symbol represents a process in a DFD?
A circle (Yourdon–DeMarco) or a rounded rectangle with a number band at the top (Gane–Sarson). The process is numbered — 1.0, 2.0, then 1.1, 1.2 at the next level — and named with a verb and an object.
Does a context diagram have data stores?
No. A context diagram shows the whole system as a single process (numbered 0), the external entities, and the flows between them. Data stores are inside the system and first appear on the level-0 diagram.
Can a data flow go directly from an external entity to a data store?
No. Every data flow must have a process at one end. Entities cannot read or write stores directly, and data cannot flow from one store to another without a process in between.
What does 'balancing' mean in a DFD?
The inputs and outputs of a child diagram must match the inputs and outputs of the parent process it decomposes. If process 2.0 has three flows attached on level 0, its level-1 diagram must show exactly those three flows crossing its boundary.
How many processes should a DFD have?
Roughly seven, plus or minus two, per diagram. If a level needs more, decompose one of its processes into a lower level instead of crowding the page.
What is the difference between a DFD and a flowchart?
A DFD shows data movement and storage with no notion of sequence or decisions; a flowchart shows the order of steps and where logic branches. They answer different questions and are often used together.