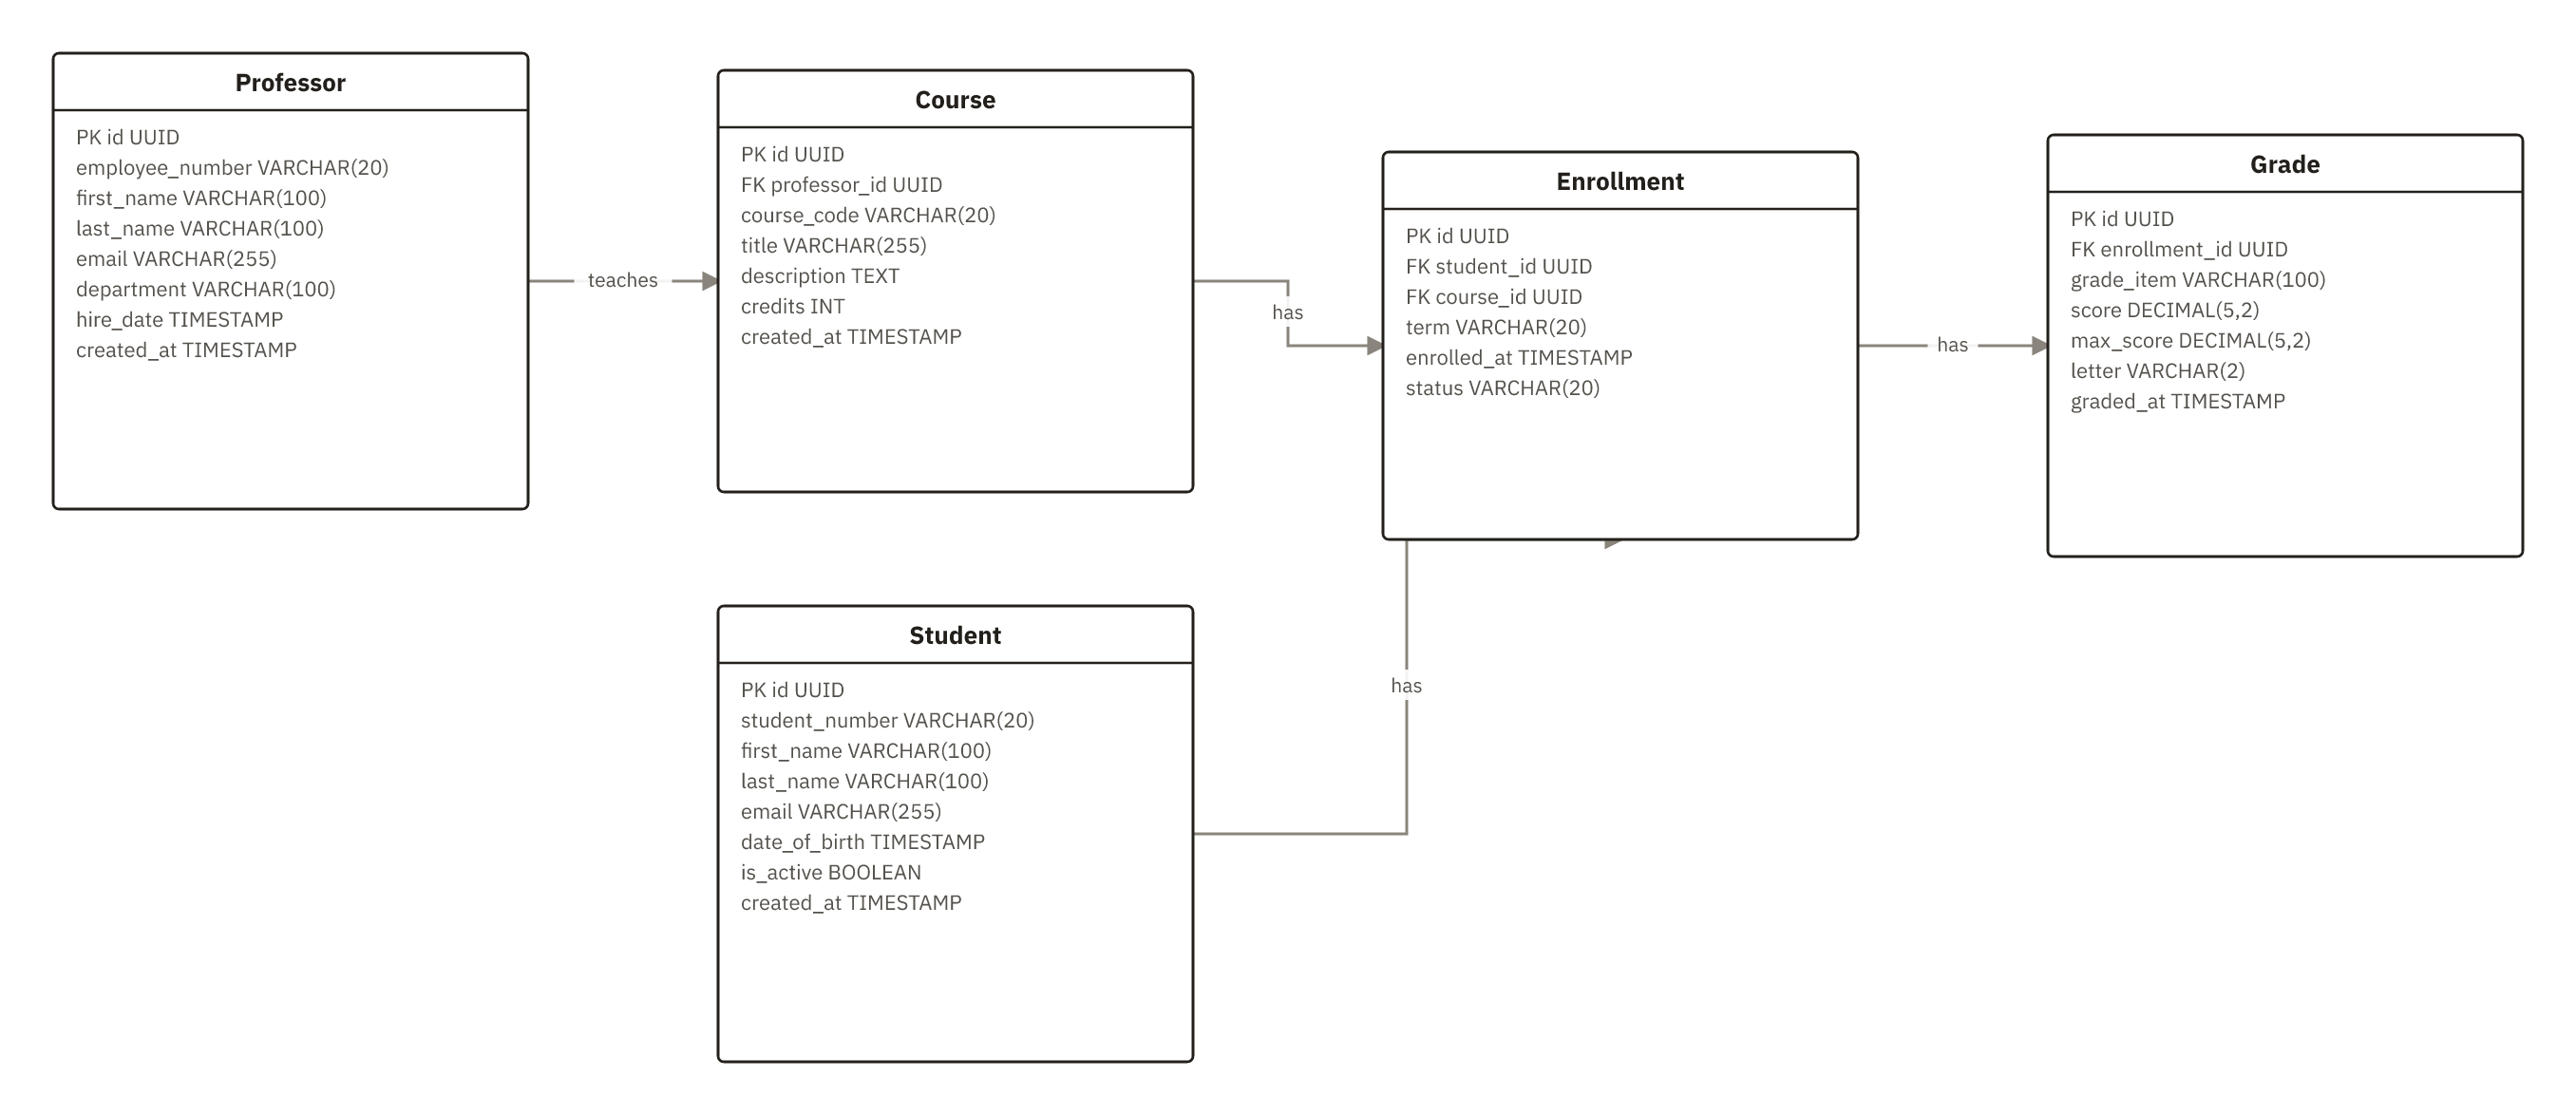
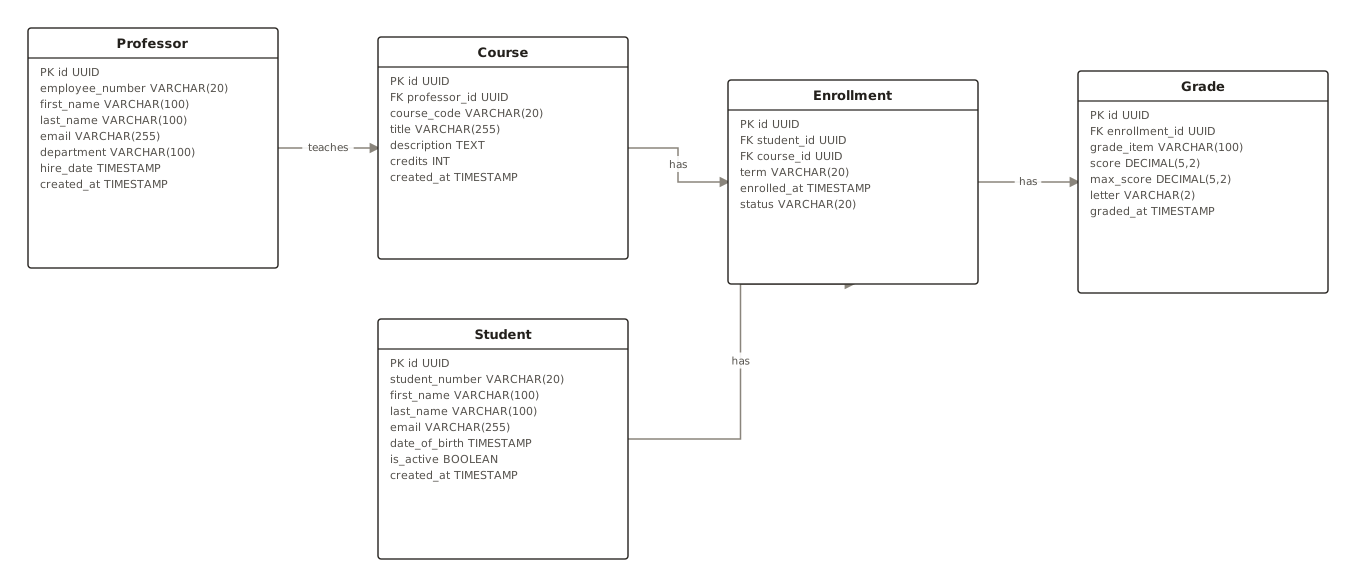
University ER Diagram for Students, Courses, Enrollments, Professors, and Grades
This ER diagram is used to design a university database that connects students to courses through enrollments, links each course to the professor who teaches it, and records detailed grade items per enrollment. It helps ensure correct keys and relationships for tracking rosters by term, enrollment status, and grading outcomes (scores and letters). Database designers, campus IT teams, and registrar or academic operations staff would use it to build and validate student information and reporting systems.
ER DiagramUniversity databaseCourse enrollmentStudent recordsGrades
5 nodes
4 connections