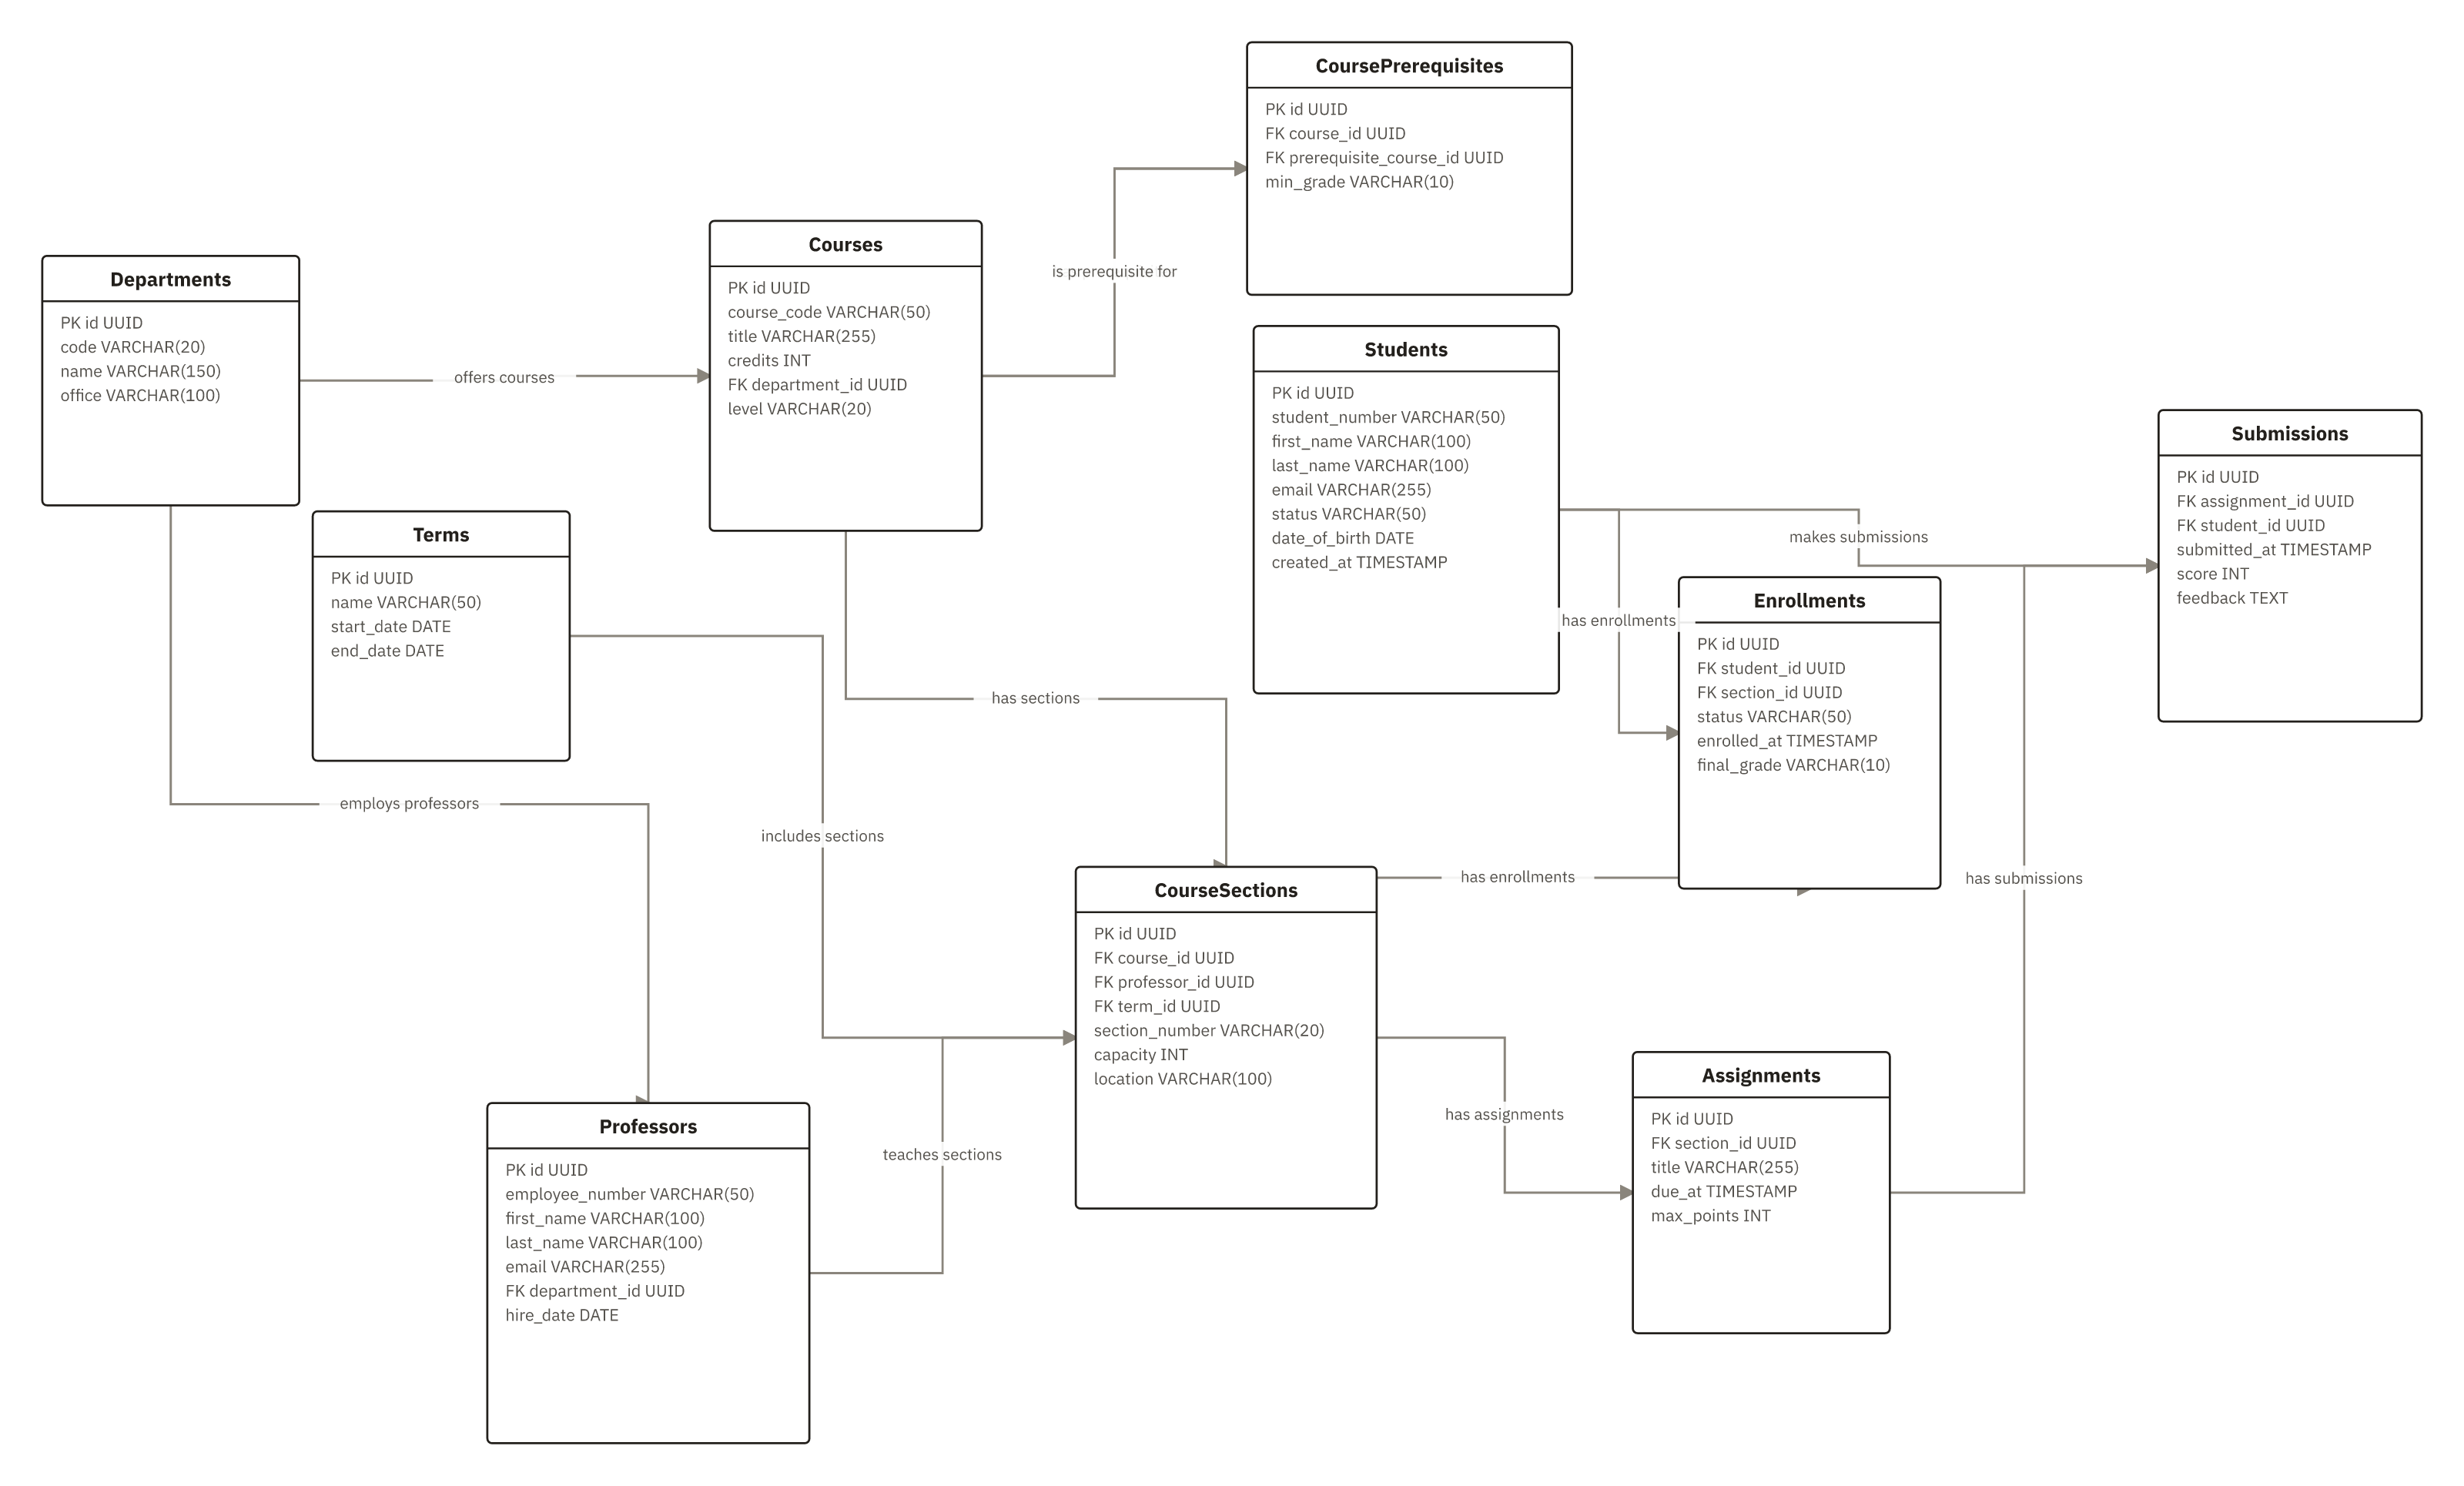
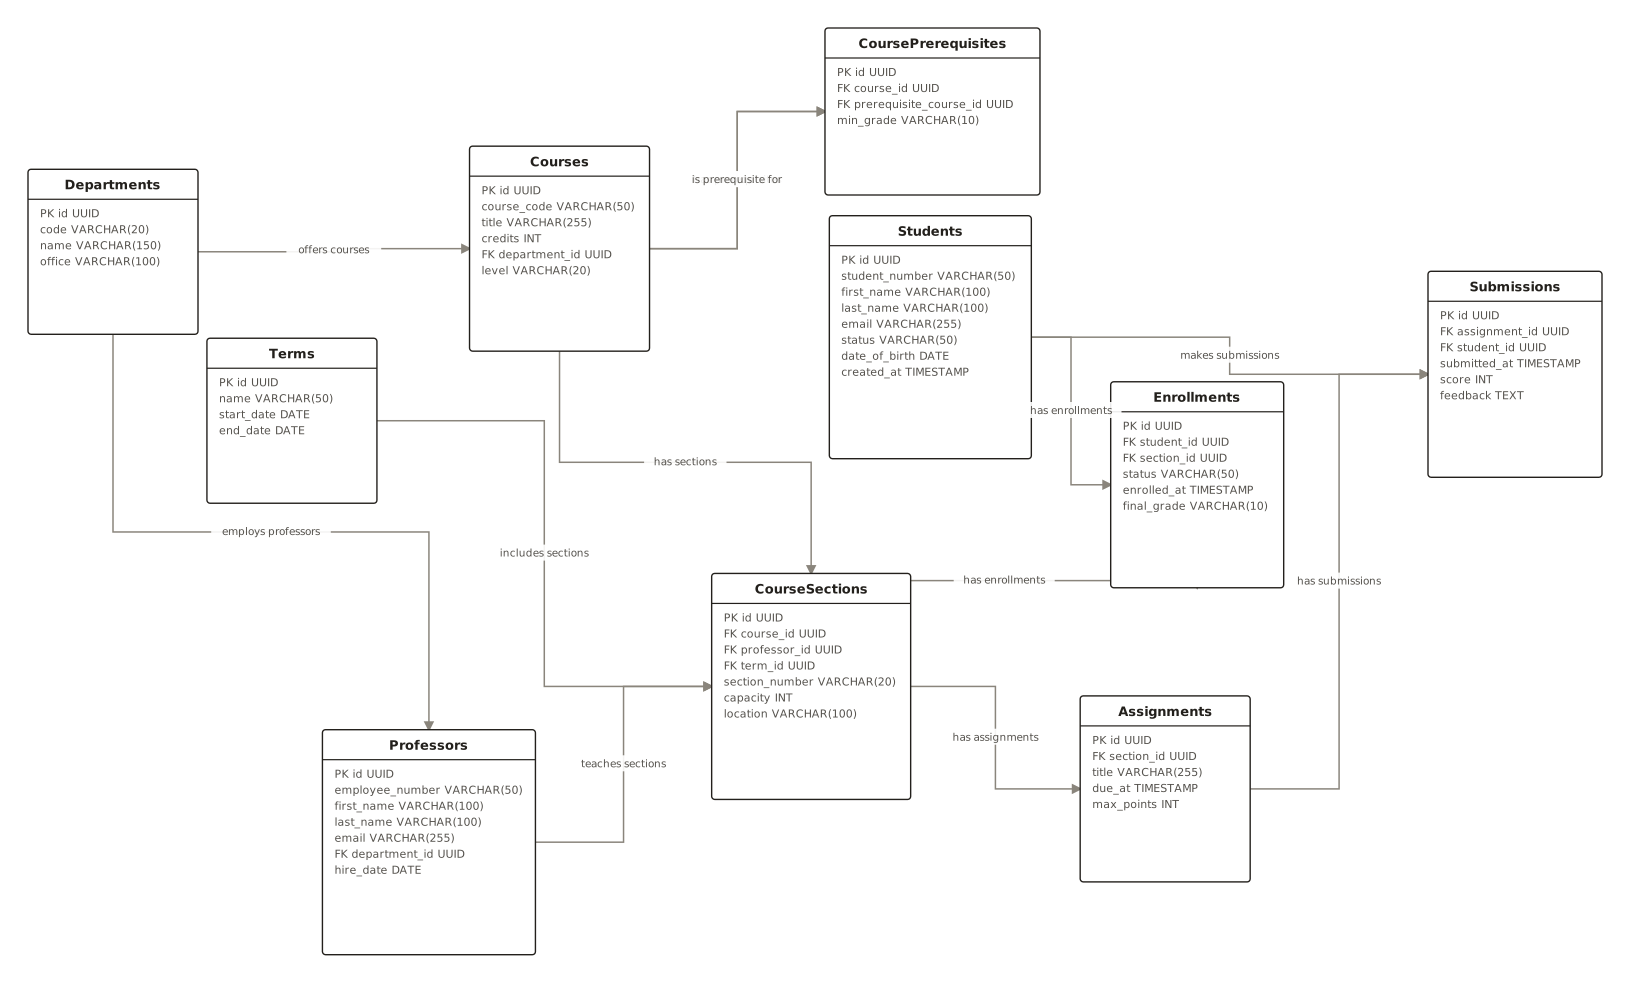
University System ER Diagram for Courses, Sections, Enrollments, and Grading
This ER diagram is used to design a university academic database by defining how Students, Departments, Courses, Professors, Terms, and CourseSections relate through Enrollments and track learning via Assignments and Submissions. It helps teams enforce referential integrity for course offerings, section scheduling, teaching assignments, prerequisite rules, enrollment status, grades, and submission scoring. It’s used by database designers, developers, and registrar/academic systems analysts.
ER DiagramUniversity databaseCourse enrollmentAcademic recordsSchema design
10 nodes
12 connections