University Enrollment Flowchart for Students, Courses, Professors, and Records
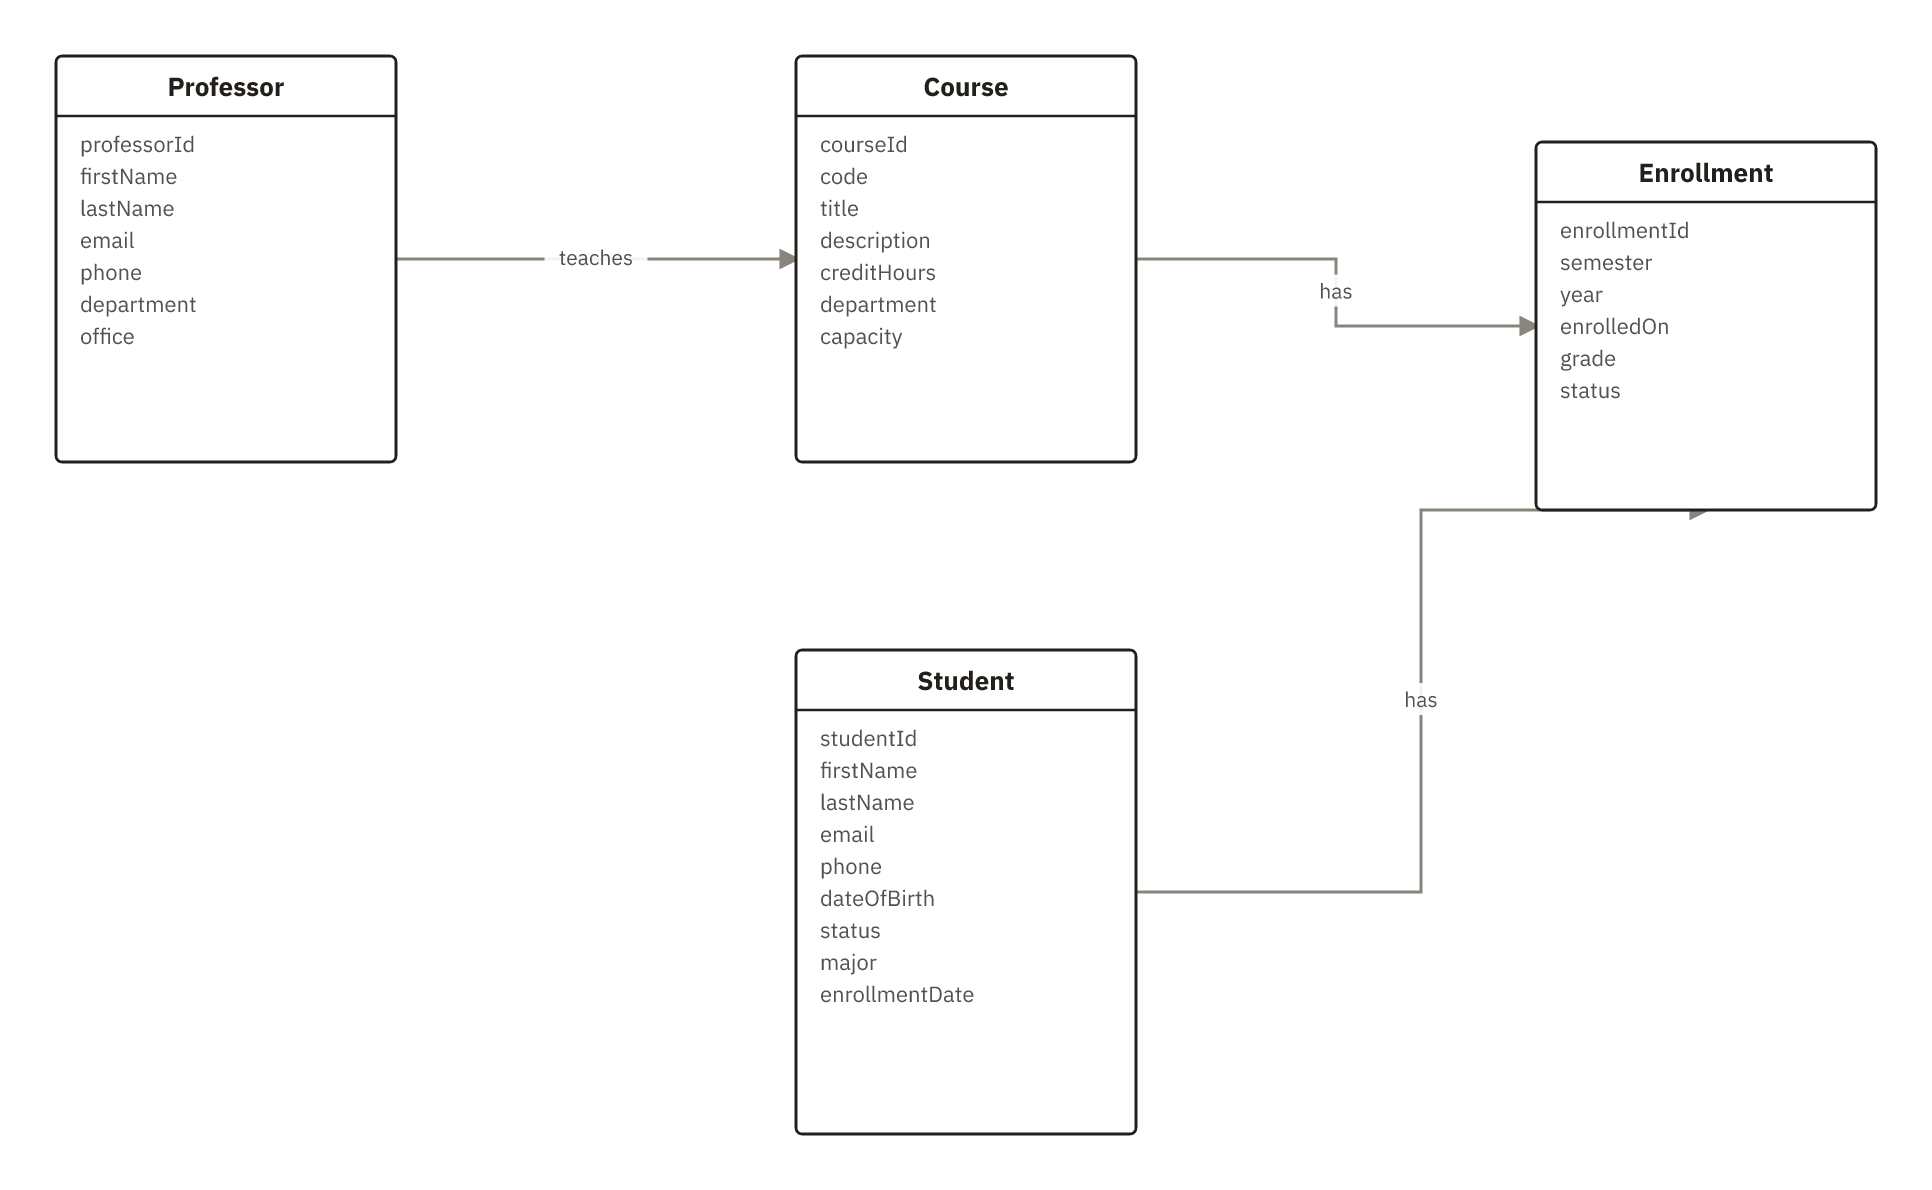
This flowchart is used to map how student records connect to enrollment records, how courses link to each enrollment, and how professors teach courses within a university enrollment model. It helps teams clarify ownership of student, course, professor, and enrollment data, track semester and grade information, and spot relationship gaps when expanding class properties. It is useful for registrars, university admins, developers, and database designers.
flowchartuniversityenrollmentcourse recordsstudent data
4 nodes
3 connections