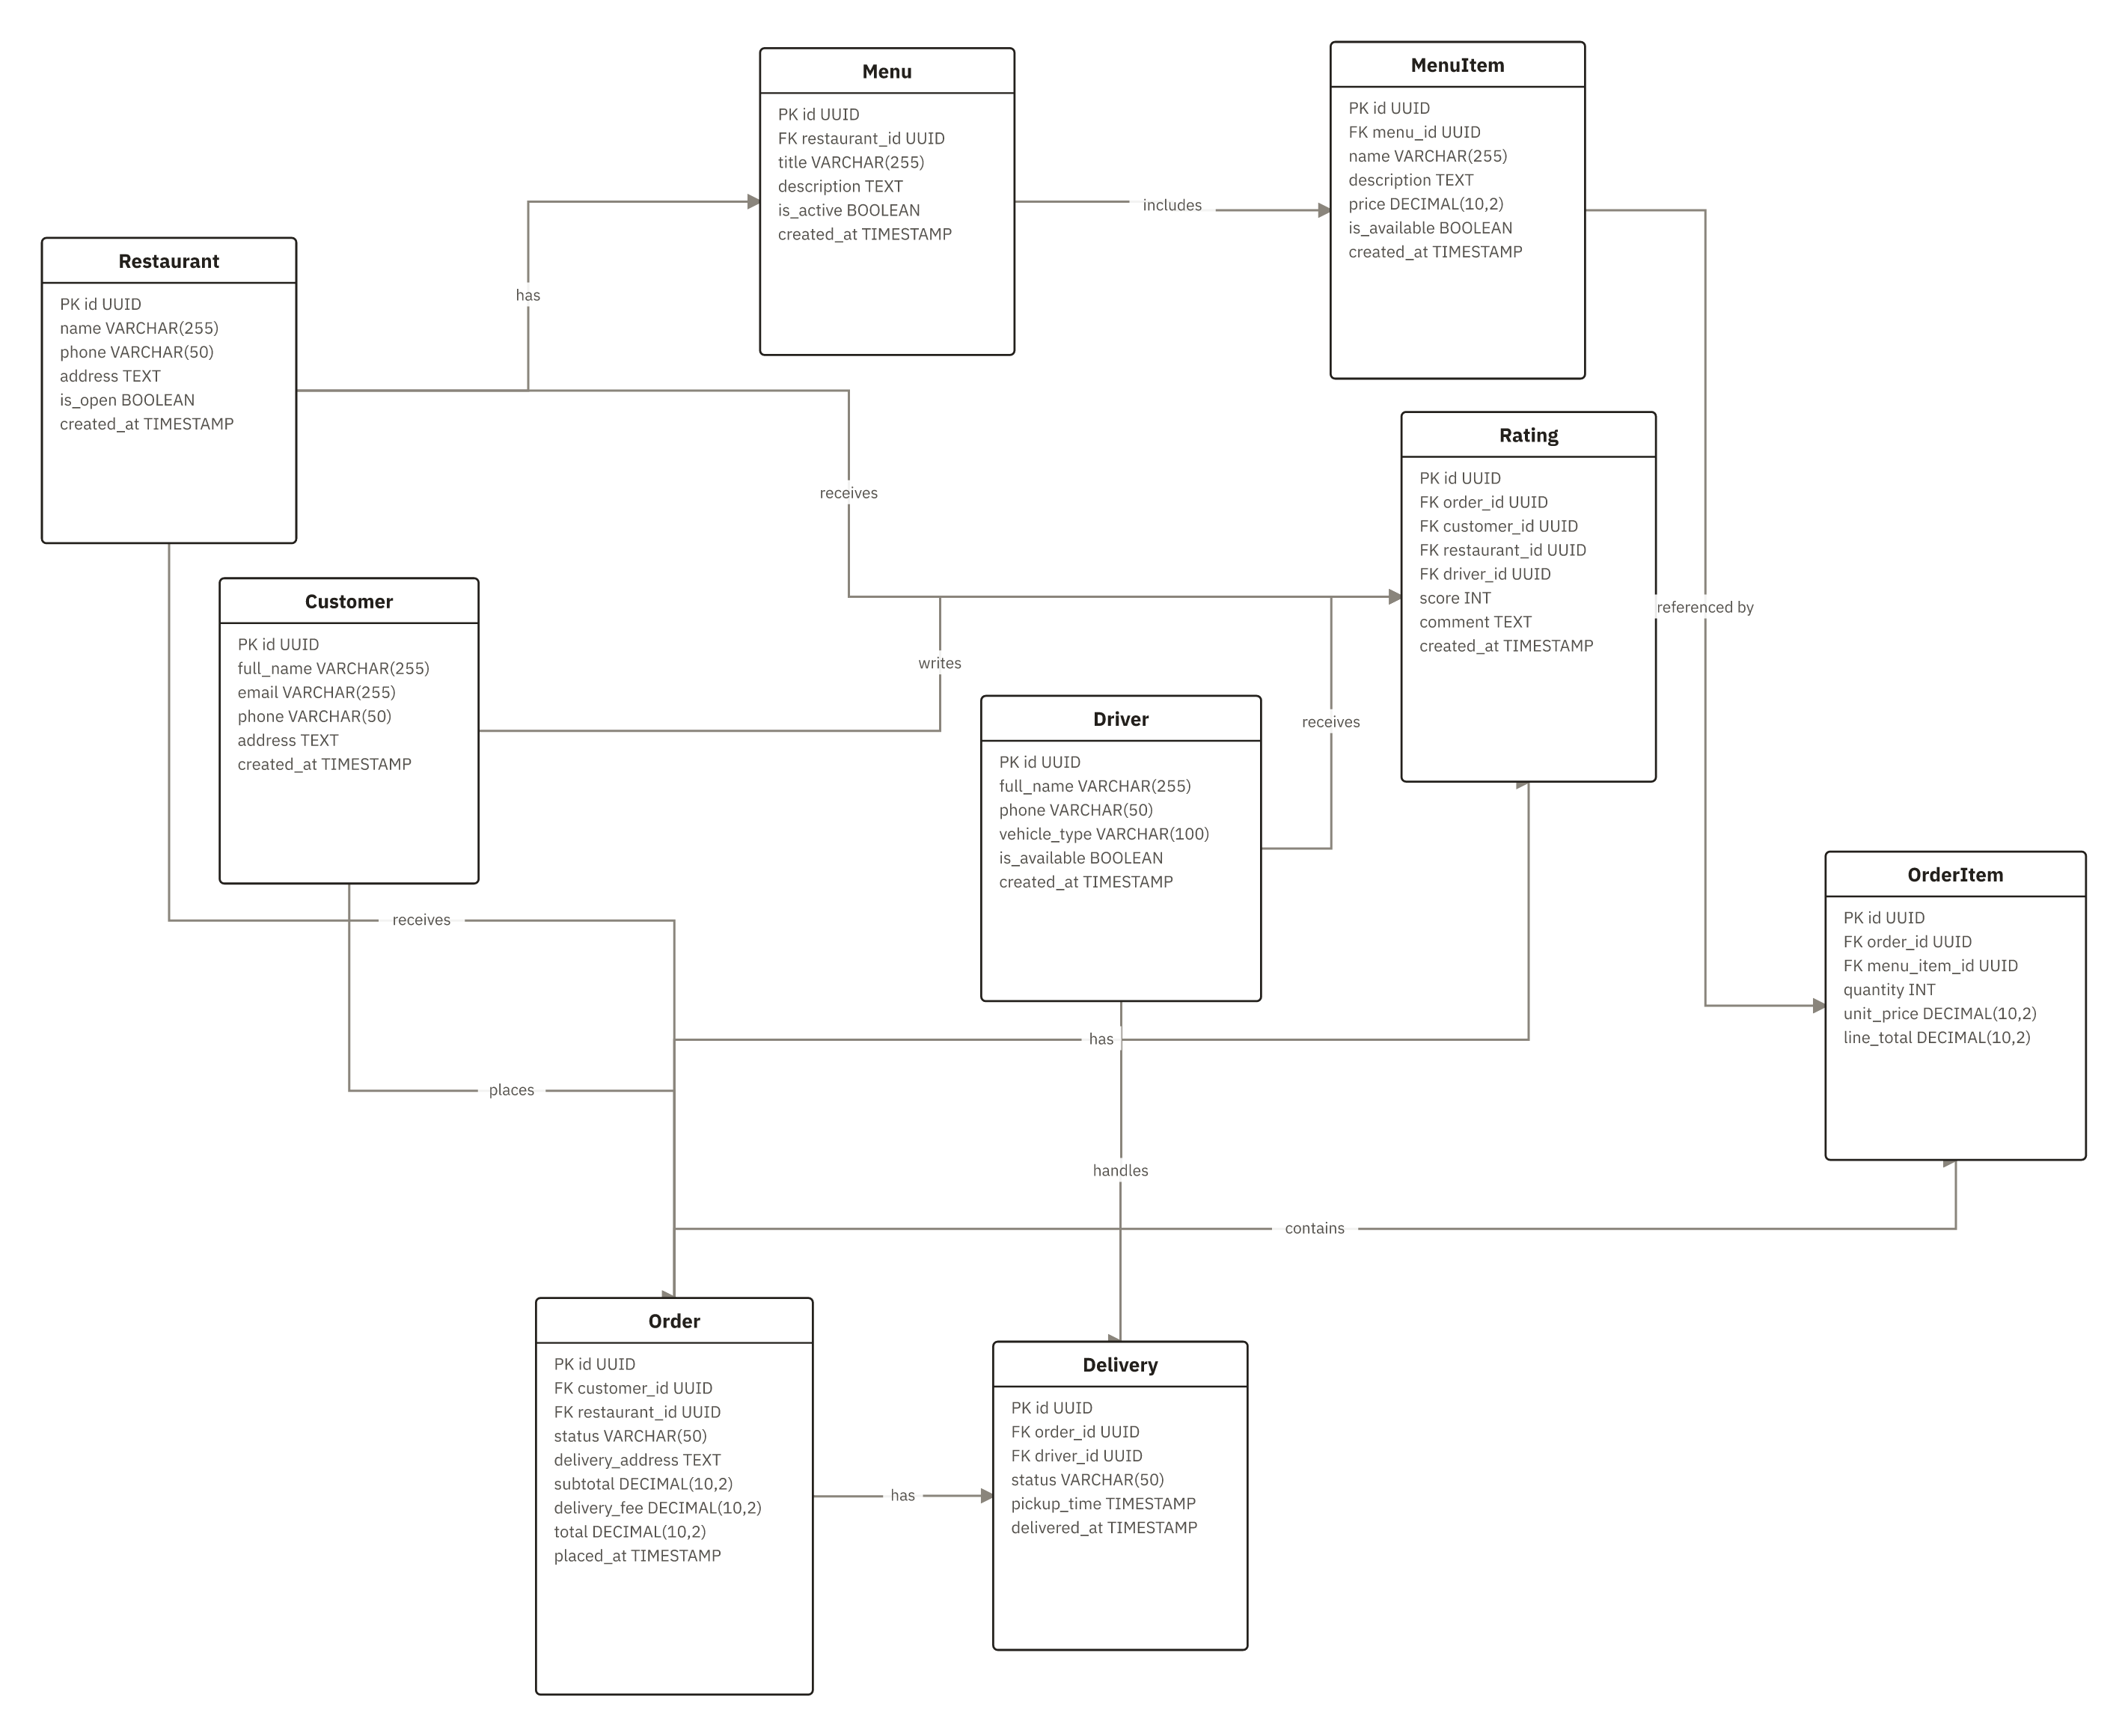
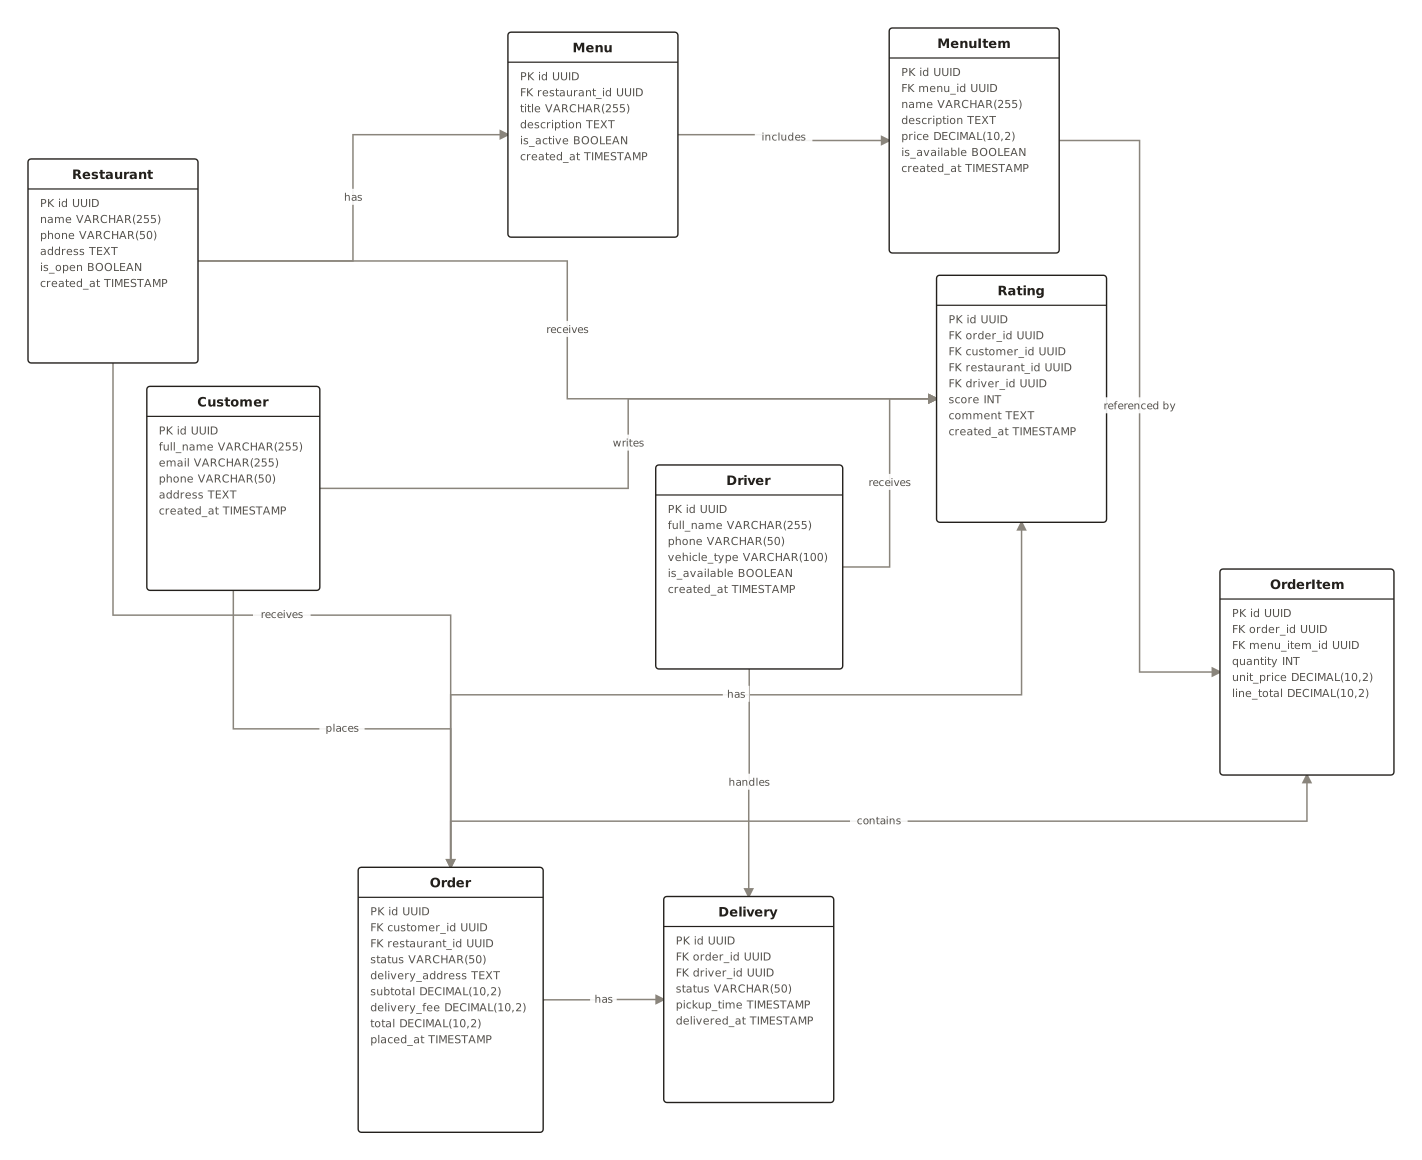
Food Delivery Platform ER Diagram
This ER diagram is used to design and validate a food delivery platform database by mapping how restaurants own menus and menu items, customers place orders, orders contain order items, drivers handle deliveries, and customers leave ratings tied to orders, restaurants, and drivers. It helps teams structure data, enforce relationships, and support ordering, delivery tracking, and feedback features, making it useful for product managers, developers, DBAs, and system architects.
ER DiagramFood DeliveryDatabase SchemaOrder ManagementDelivery App
9 nodes
13 connections