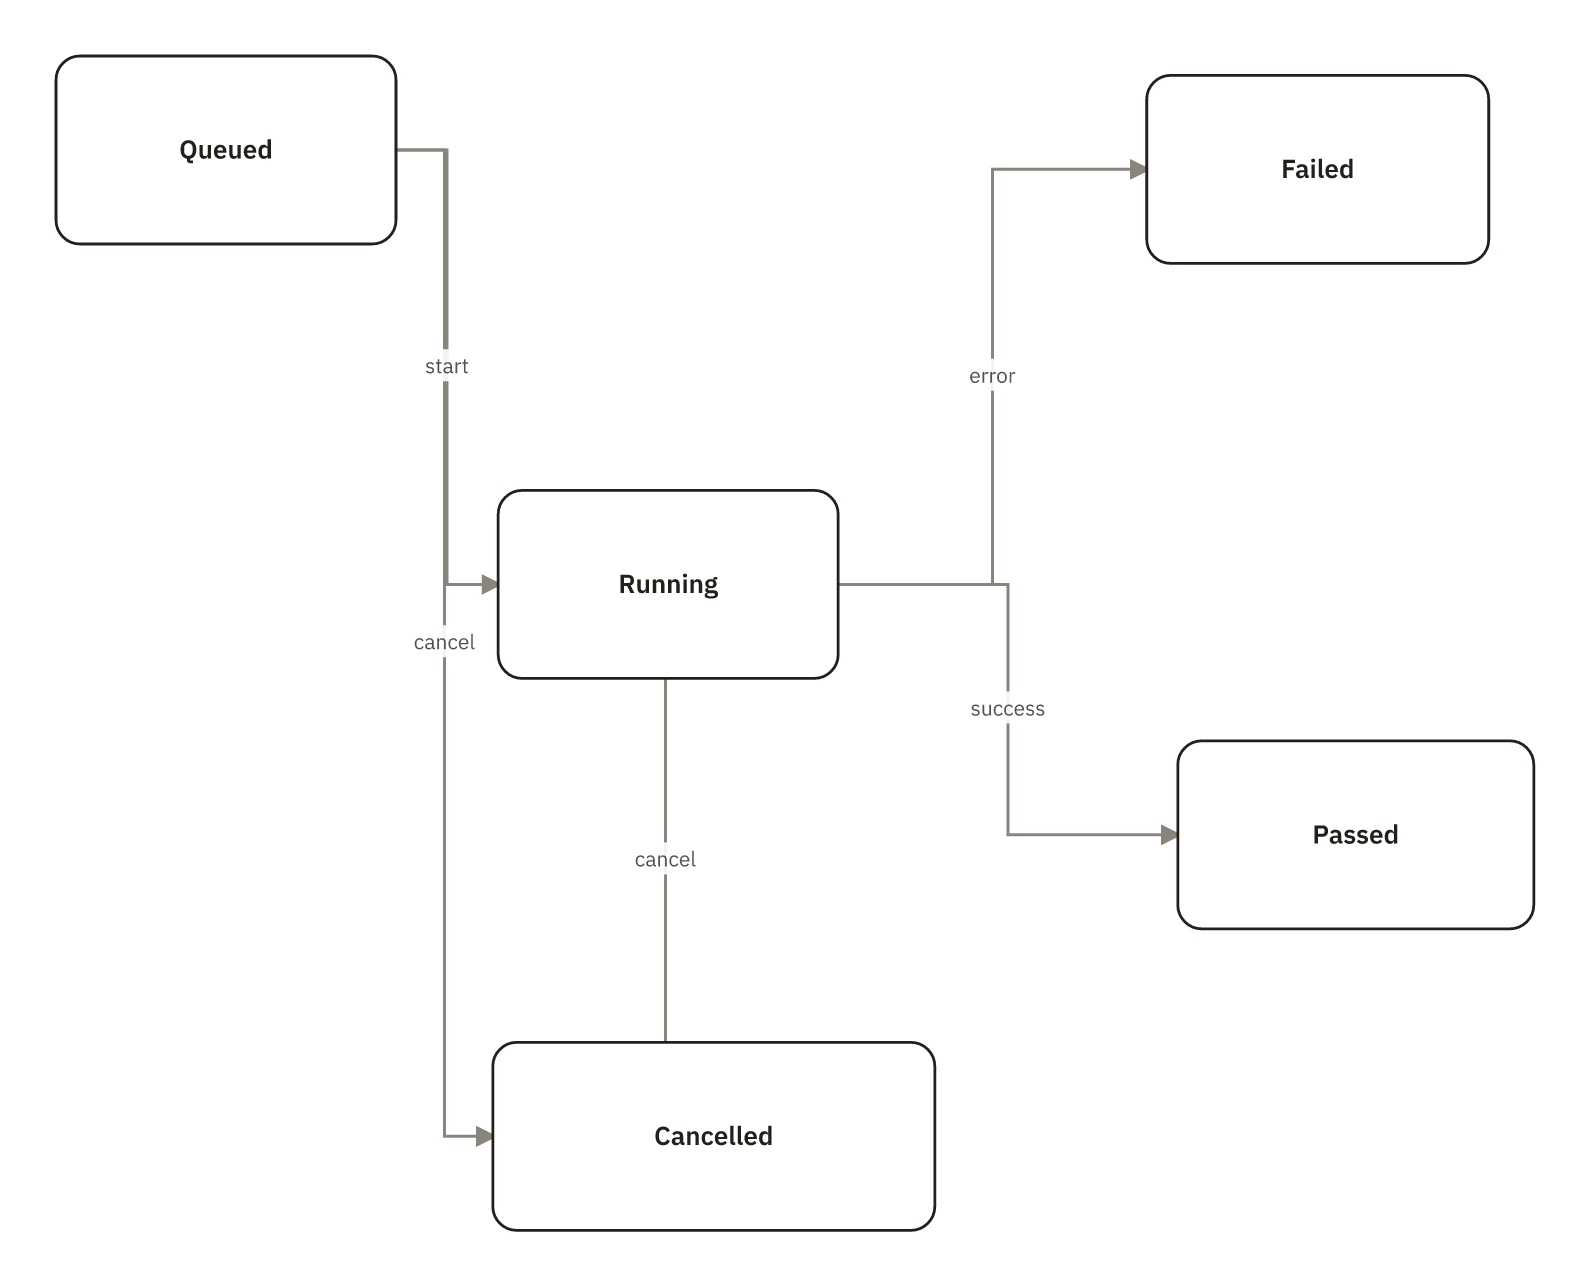
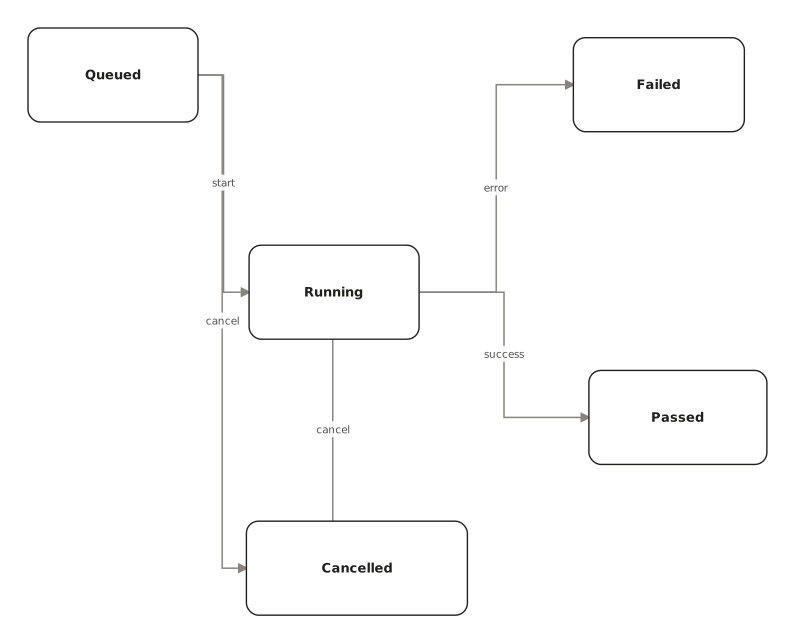
CI/CD Pipeline Job State Diagram
A state diagram for a CI/CD pipeline job maps how work moves from Queued to Running, then ends as Passed, Failed, or Cancelled, with cancellation possible before or during execution. It is used to define valid job behavior and terminal outcomes, helping teams reason about automation flow, error handling, and interruption rules. DevOps engineers, platform teams, QA leads, and developers would use it to align pipeline design and operations.
CI/CDstate diagrampipeline jobdevopsjob lifecycle
5 nodes
5 connections